Can Bitcoin Make You a Millionaire Today?
Bitcoin can make someone a millionaire, but it usually requires either a large starting investment, a very low entry price, or many years of strong price growth. Today, Bitcoin already trades at a high market value, so the easiest gains from the early years no longer exist. That does not mean the opportunity has disappeared. It means beginners need realistic expectations.
If someone buys a small amount of BTC today, they should not expect it to turn into $1 million quickly. For example, a $500 or $1,000 investment would need an extreme price increase to reach millionaire status. However, a person who already owns several BTC could reach that level if Bitcoin rises sharply in the future. So, can Bitcoin make you a millionaire? Yes, but not in a guaranteed or simple way. The final result depends on your BTC amount, your buying price, market cycles, and how well you manage investment risk.
How Much Bitcoin Is Needed to Reach $1 Million?
The amount of Bitcoin needed to become a millionaire changes with the Bitcoin price. The calculation is simple: divide $1 million by the price of one BTC. If Bitcoin trades near $62,800, you would need about 15.92 BTC to reach $1 million in value. If Bitcoin rises to $100,000, you would need 10 BTC. If it reaches $250,000, you would need 4 BTC. At $500,000, you would need 2 BTC. If Bitcoin ever reaches $1 million per coin, then 1 BTC would make you a millionaire before taxes, fees, or selling costs.
This is why the question “how much bitcoin needed to be a millionaire” has no fixed answer. It depends on the future price and the amount you hold. Beginners should also remember that portfolio value changes every day. Bitcoin can rise fast, but it can also fall hard. Because of that, the goal should not focus only on the final number. It should also include risk, patience, and a clear plan.
Bitcoin Price Scenarios for Becoming a Millionaire
Bitcoin price scenarios help show why BTC ownership matters as much as the market price. The higher Bitcoin climbs, the less BTC someone needs to hold $1 million in value. However, every price target carries different levels of risk and uncertainty. A move to $100,000 would still require a large amount of capital for most beginners. A move to $250,000 would make the goal easier for people with several BTC, but it would still not turn very small holdings into life-changing wealth. The famous Bitcoin $1 million scenario changes the math completely because one full BTC would equal $1 million before taxes and fees.
These examples do not predict the future. They simply show how the calculation works. Bitcoin can move through powerful bull markets, but it can also lose value during long downturns. That is why beginners should treat every scenario as a planning tool, not a promise.
| Bitcoin Price | BTC Needed for $1 Million | What It Means |
| $100,000 | 10 BTC | Requires a very large holding |
| $250,000 | 4 BTC | Still difficult for most beginners |
| $500,000 | 2 BTC | Possible only with strong long-term growth |
| $1,000,000 | 1 BTC | One full BTC reaches millionaire value |
Can 1 Bitcoin Make You a Millionaire?
Yes, 1 Bitcoin can make you a millionaire if Bitcoin reaches $1 million per coin. This idea may sound extreme, but some well-known Bitcoin supporters have made similar forecasts. Cathie Wood from ARK has discussed a path toward Bitcoin near $1 million by 2030, while Michael Saylor has argued that BTC could reach $1 million within a longer time frame.
Still, beginners should treat these predictions as opinions, not guarantees. Bitcoin would need massive demand from investors, companies, funds, and possibly governments to reach that level. So, can 1 Bitcoin make you a millionaire? Yes, but only if the market grows far beyond today’s size. Until then, 1 BTC remains a powerful holding, but not a guaranteed ticket to $1 million.
How Much Would You Need to Invest in Bitcoin?
The amount you need to invest in Bitcoin depends on three things: the current BTC price, the amount of BTC you want to own, and your future price target. Bitcoin is divisible, so you do not need to buy a full coin. You can own a fraction of BTC, and the smallest unit is called a satoshi. This makes Bitcoin more accessible because a beginner can start with a small amount instead of trying to buy 1 BTC at once.
However, each platform can set its own minimum order size. For example, Kraken says a standard BTC trade must be at least 0.0001 BTC, while its instant buy option starts from 1 USD, EUR, GBP, CAD, CHF, or AUD. Card purchases on Kraken start from 10 USD or 10 EUR.
So, when someone asks “how much bitcoin should I buy,” the better question is: how much can you invest without damaging your budget?
Example Investment Scenarios
Small Bitcoin investments can grow if the BTC price rises, but the final value depends on the amount you buy. For example, someone who buys $100 of Bitcoin owns only a small fraction of BTC. If Bitcoin doubles, that investment becomes about $200 before fees and taxes. If Bitcoin grows 10 times, it becomes about $1,000. That is a strong return, but it does not create a millionaire.
Larger investments change the math, although they also increase investment risk. A person who buys $10,000 worth of BTC has a much better chance of reaching a large portfolio value if Bitcoin enters a major bull market. Still, the result depends on the entry price and the future BTC price.
| Investment Size | If Bitcoin 2x | If Bitcoin 5x | If Bitcoin 10x |
| $100 | $200 | $500 | $1,000 |
| $1,000 | $2,000 | $5,000 | $10,000 |
| $10,000 | $20,000 | $50,000 | $100,000 |
These examples show a simple truth: small amounts can grow, but millionaire results usually require larger capital, more BTC, or much higher Bitcoin prices.
Why Bitcoin Entry Price Matters
Your entry price matters because it decides how much BTC you receive for the same amount of money. If you invest $1,000 when Bitcoin costs $50,000, you get 0.02 BTC. If you invest the same $1,000 when Bitcoin costs $100,000, you get only 0.01 BTC. The difference may look small, but it becomes important if Bitcoin reaches much higher prices later.
This is why many investors use dollar-cost averaging instead of trying to buy the perfect dip. They buy smaller amounts over time, so they reduce the risk of entering the market at one unlucky moment. However, no method removes Bitcoin volatility. A lower entry price can improve your upside, but a clear budget protects you from investing more than you can afford to lose.
Could 0.1 BTC or 0.01 BTC Make You a Millionaire?
A small Bitcoin holding can become valuable, but the millionaire math gets difficult very quickly. If you own 0.1 BTC, Bitcoin would need to reach $10 million per coin for your holding to equal $1 million before taxes and fees. This is why the phrase 0.1 Bitcoin millionaire describes a very ambitious scenario, not a realistic short-term expectation. It would require Bitcoin to grow far beyond even the most popular long-term price targets.
The situation looks even harder with 0.01 BTC. In that case, Bitcoin would need to reach $100 million per coin for the holding to be worth $1 million. That does not mean small BTC amounts have no value. They can still help beginners build exposure, learn how Bitcoin works, and grow wealth over time if the market rises. However, 0.1 BTC and 0.01 BTC should not create false expectations. These amounts may become meaningful savings, but they would need extreme price growth to create a millionaire result on their own.
How to Become a Bitcoin Millionaire Responsibly
The responsible way to chase a Bitcoin millionaire goal starts with a plan, not emotion. Bitcoin can rise fast, but it can also fall sharply, so beginners should never treat it like a guaranteed path to wealth. A smart approach begins with a personal budget. You need to know how much money you can invest without touching rent, bills, savings, emergency funds, or debt payments.
The next step is choosing a clear strategy. Some people buy once and hold it for years. Others use dollar-cost averaging, which means they invest smaller amounts on a regular schedule. This method can reduce stress because you do not need to guess the perfect buying moment. It also helps you build a BTC position over time.
Security matters as much as profit. If you want to know how to become a bitcoin millionaire, you also need to know how to protect your coins. Use strong passwords, enable two-factor authentication, and learn the difference between keeping BTC on an exchange and storing it in a private wallet. Owning Bitcoin also means taking responsibility for access and safety.
Finally, keep expectations realistic. Bitcoin may create large returns, but every investment carries risk. The goal should not be to get rich overnight. The better goal is to build knowledge, manage risk, and make decisions that still make sense if the market moves against you.
Long-Term Holding and Dollar-Cost Averaging
Many investors who ask how to become a millionaire with Bitcoin focus on long-term holding because BTC has moved through several major market cycles. The idea is simple: you buy Bitcoin, keep it through ups and downs, and wait for the market to grow over time. However, holding requires patience because Bitcoin can fall hard during bear markets.
Dollar-cost averaging can make this process easier for beginners. Instead of investing one large amount at once, you buy smaller amounts on a regular schedule, such as weekly or monthly. This approach helps you avoid the stress of guessing the perfect entry price. It also builds discipline. Dollar-cost averaging does not remove risk, but it can make Bitcoin investing more manageable and less emotional.
Risk Management and Secure Storage
Risk management starts before you buy Bitcoin. You should decide how much money you can invest without hurting your daily life, your emergency savings, or your long-term financial stability. Bitcoin volatility can create large gains, but it can also cut portfolio value quickly. For this reason, beginners should avoid borrowing money, using high leverage, or investing cash they may need soon.
Crypto wallet security also plays a major role. If you keep Bitcoin on an exchange, you depend on that platform. If you use a private wallet, you control your coins, but you must protect your seed phrase. Store it offline, never share it, and never type it into random websites. A strong Bitcoin plan protects both your money and your access to it.
What Could Stop Bitcoin From Making You a Millionaire?
Bitcoin can create large returns, but several things can stop it from turning an investor into a millionaire. The first risk is price movement. Bitcoin does not rise in a straight line. It can grow quickly during a bull market, then lose a large part of its value during a bear market. A person who buys near the top may need years to recover.
The second risk is unrealistic expectations. Many beginners ask, “Will Bitcoin make me a millionaire?” but the answer depends on the amount of BTC they own, their entry price, and future market demand. A small investment cannot easily become $1 million unless Bitcoin reaches an extremely high price.
Regulation can also affect the market. New rules for exchanges, taxes, stablecoins, custody, or institutional access may change how easily people buy and hold BTC. Security creates another major risk. If someone loses a seed phrase, sends BTC to the wrong address, or falls for a scam, they may lose access forever.
That is why Bitcoin needs more than belief. A realistic plan must include risk, security, patience, and clear investment limits.
Volatility, Regulation, and Market Cycles
Bitcoin volatility can make the road to millionaire status difficult. BTC may rise quickly when demand grows, but it can also drop sharply when fear returns to the market. These swings often follow market cycles. During bull markets, investors become more confident and prices can climb fast. During bear markets, weak demand and panic selling can push prices much lower.
Regulation adds another layer of uncertainty. Clear rules can help Bitcoin grow because large investors may feel safer entering the market. However, strict rules, tax changes, or limits on crypto platforms can reduce demand in some regions. For beginners, this means one thing: Bitcoin can offer upside, but the path will likely include strong corrections and stressful periods.
Personal Budget and Investment Limits
Your personal budget matters more than any Bitcoin price prediction. Even if you believe BTC can grow for many years, you should not invest money that you need for rent, food, debt, insurance, or emergency savings. A bad budget can turn normal market volatility into real financial pressure.
The safest approach is to set a fixed investment limit before buying. That limit should match your income, expenses, and risk tolerance. If Bitcoin falls, you should still be able to live normally. No millionaire goal is worth damaging your financial security today. Bitcoin can become part of a long-term plan, but it should not replace basic money management.\
Is Becoming a Bitcoin Millionaire by 2030 Realistic?
Becoming a Bitcoin millionaire by 2030 is possible, but it depends on how much BTC someone owns today. At a Bitcoin price near $62,850, a person would need about 15.9 BTC to hold $1 million in value right now. If Bitcoin reached $250,000 by 2030, that person would need 4 BTC. If BTC reached $500,000, they would need 2 BTC. If Bitcoin reached $1 million, then 1 BTC would be enough.
Some bullish forecasts support the idea of a much higher BTC price. ARK Invest published 2030 Bitcoin scenarios of about $300,000 in a bear case, $710,000 in a base case, and $1.5 million in a bull case. Still, these are projections, not promises. So, when beginners ask how much Bitcoin to be a millionaire by 2030, the honest answer is simple: the goal looks more realistic for people who already hold at least 1–4 BTC, while smaller holdings would need an extremely strong bull market.
FAQ
How Much Bitcoin Do I Need to Be a Millionaire?
The amount changes with the Bitcoin price. If BTC costs $100,000, you need 10 BTC to reach $1 million. If BTC reaches $500,000, you need 2 BTC. If Bitcoin reaches $1 million, you need 1 BTC. So, how much Bitcoin do I need to be a millionaire depends on the future market price.
How Many Bitcoin Do You Need to Become a Millionaire?
The answer depends on your price target. At $250,000 per BTC, you need 4 BTC. At $500,000 per BTC, you need 2 BTC. At $1 million per BTC, one full Bitcoin would make your holding worth $1 million before taxes, exchange fees, or selling costs.
Can I Become a Millionaire With Bitcoin?
Yes, you can become a millionaire with Bitcoin, but it is not guaranteed. The result depends on how much BTC you own, your entry price, your holding period, and future demand. Beginners should treat Bitcoin as a high-risk investment, not a certain shortcut to wealth.
Can You Become a Millionaire From Bitcoin?
Yes, some investors can become millionaires from Bitcoin if they buy enough BTC and the price rises strongly over time. However, small investments need extreme growth to reach $1 million. Bitcoin can create big gains, but it also carries serious investment risk.
Has Anyone Become a Millionaire From Bitcoin?
Yes, many early Bitcoin investors became millionaires because they bought BTC when the price was much lower. Some miners, long-term holders, and early adopters gained life-changing wealth. However, today’s market is larger and more mature, so repeating those early returns is much harder.
How Much Bitcoin Should I Buy?
There is no single correct answer to “how much Bitcoin should I buy.” It depends on your income, savings, debt, risk tolerance, and long-term goals. A beginner should only invest money they can afford to lose. For many people, a small regular purchase through dollar-cost averaging works better than one emotional large buy.
Follow us on Medium, X, Telegram, YouTube, and Publish0x to stay updated about the latest news on StealthEX and the rest of the crypto world.
Don’t forget to do your own research before buying any crypto. The views and opinions expressed in this article are solely those of the author.
Bitcoin Bitcoin BTC Bitcoin price prediction BTC price prediction price analysisThe post How Much Bitcoin Do You Need to Become a Millionaire? first appeared on StealthEX.]]>

Can Shiba Inu Reach $1 in 2026?
Shiba Inu is very unlikely to reach $1 in 2026. The main reason is not only price, but also supply. SHIB still has around 589 trillion tokens in circulation, so even a small move in price requires a huge amount of new money.
For SHIB to trade at $1, its market value would need to rise to hundreds of trillions of dollars, unless the supply fell dramatically first. That would make Shiba Inu bigger than the entire crypto market, the largest public companies, and even many global asset classes. The math does not support a $1 target for 2026.
However, this does not mean SHIB cannot grow. A strong bull market, better ecosystem use, higher demand, exchange listings, and larger token burns could support price gains. SHIB also has a large community, and community interest can still move meme coins during speculative market phases. Still, investors should separate possible upside from unrealistic price targets. In 2026, $1 looks like an extremely unrealistic target, not a normal Shiba Inu price prediction.
Why Is the $1 Target So Difficult?
The Shiba Inu $1 target sounds simple because the number looks small. However, crypto prices only make sense when investors compare price with supply. If one token costs $1 and almost 589 trillion tokens exist, the market cap would sit near $589 trillion. That number would be far beyond today’s realistic crypto market size and far beyond normal meme coin valuations.
Market cap means token price multiplied by circulating supply. For example, if SHIB trades at $0.000004, it can have a market value of only a few billion dollars because each token is cheap. But if the same supply trades at $1, the market value explodes. This is why beginners should never judge a coin only by its low price. A coin can look cheap and still need an enormous amount of capital to grow.
A move to $1 would also require demand on a scale that the market has never shown for a meme coin. Buyers would need to absorb huge selling pressure from holders who bought SHIB much lower. Many early investors would likely take profit long before $1, and that selling could slow any rally. For that reason, the $1 target depends on impossible-looking market cap math unless supply drops by hundreds of trillions of tokens first.
SHIB Supply and Market Cap
SHIB has a supply problem that beginners must understand before they follow any shiba inu coin $1 prediction. According to major market trackers, more than 589 trillion SHIB tokens trade in the market. Because market cap equals price multiplied by circulating supply, a $1 price would create a value near $589 trillion. That figure would not look like a normal crypto rally. It would require SHIB to become larger than the biggest financial markets in the world. For comparison, even Bitcoin has never reached that size. So, without a huge supply reduction and unmatched demand, the $1 target does not fit basic market cap logic.
How Much Would SHIB Need to Grow?
To understand the SHIB to $1 idea, compare $1 with SHIB’s current micro-price. If SHIB trades near $0.000004, a move to $1 would mean an increase of about 25,000,000%. That is not a typical bull market gain. It is a life-changing return that would demand extreme demand, constant buying pressure, and far less supply. Even if SHIB rose 10x or 100x, it would still remain far below $1. This is why investors should measure growth in realistic steps, such as removing one or two zeros, instead of focusing only on the final dollar target. That approach gives a clearer view of risk and reward.
Shiba Inu Price Prediction 2026
A realistic Shiba Inu price prediction 2026 should begin with current market data, not social media hype. According to CoinMarketCap, SHIB recently traded near $0.0000043, with a market cap close to $2.5 billion and a circulating supply of about 589.24 trillion tokens.
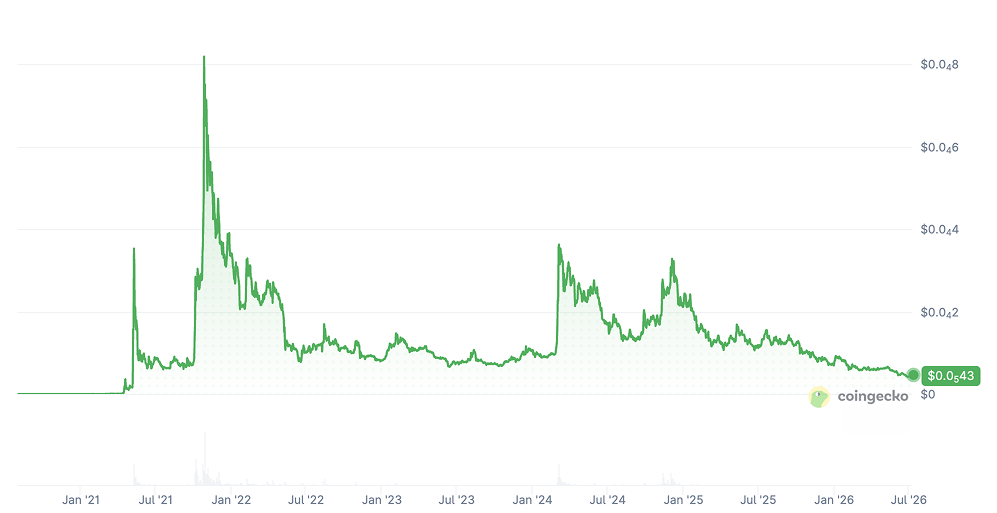
CoinGecko, July 9, 2026
These numbers matter because they show how much money SHIB needs to move higher. At the same supply, a price of $0.00001 would place SHIB near a $5.9 billion market cap, while $0.00005 would require almost $29.5 billion.
Forecasting sites also show very different views. CoinCodex gives a cautious 2026 estimate near $0.000003989 by the end of 2026. Changelly’s November 2026 range sits between about $0.00000424 and $0.00000559. CoinPedia is much more bullish and gives a 2026 range from about $0.00002 to $0.000099.
Based on these numbers, a realistic 2026 range sits far below $1. SHIB could still rise if the crypto market improves, but the $1 target would require a market cap near $589 trillion at today’s supply. That is why serious investors should compare price targets with market cap before they believe any bold prediction.
Bearish, Neutral, and Bullish Scenarios
In a bearish scenario, SHIB could stay close to its current range or move lower if crypto liquidity remains weak. A zone around $0.000003 to $0.000004 would match a cautious outlook and would also stay close to CoinCodex’s end-of-2026 forecast near $0.000003989. This scenario would show that meme coin demand remains limited.
In a neutral scenario, SHIB could trade around $0.000004 to $0.000006. This range fits closer to Changelly’s conservative monthly forecast for late 2026, which points to values around $0.00000424 to $0.00000559. In this case, SHIB would not break its long-term supply problem, but it could still hold attention from traders.
In a bullish scenario, SHIB could try to remove one zero and move toward $0.00002 or higher. CoinPedia’s 2026 forecast is much more optimistic and mentions a possible range up to $0.000099. However, even $0.000099 would place SHIB near a $58 billion market cap at the current supply. That would be a major rally, but it would still remain far from $1.
What Could Move SHIB in 2026?
The first major driver for SHIB in 2026 is the wider crypto market. If Bitcoin and large altcoins rise, traders often move into riskier assets, including meme coins. This can increase volume and push SHIB higher for a short period. However, if Bitcoin weakens, SHIB can fall faster because meme coins usually depend on market confidence.
The second driver is token utility. Shibarium, ShibaSwap, ecosystem apps, games, and community projects could help SHIB if they bring real users. Demand matters because a token with huge supply needs constant buying pressure to move higher.
The third driver is token burns. Burns reduce supply, but they must happen at a very large scale to change the long-term math. Small burns can support sentiment, yet they do not make $1 realistic by themselves.
Whale activity, exchange volume, social media trends, and meme coin hype can also move SHIB. Still, beginners should remember one key rule: SHIB can rally without reaching $1, and a realistic forecast should focus on market cap, not only token price.
Can Burns Help Shiba Inu Reach $1?
Token burns can help Shiba Inu, but they cannot make SHIB reach $1 quickly unless they remove an enormous part of the supply. According to CoinMarketCap, SHIB has about 589.24 trillion tokens in circulation. Shibburn also shows that more than 410.8 trillion SHIB have already been burned, mainly because a very large early burn removed tokens from the original supply.
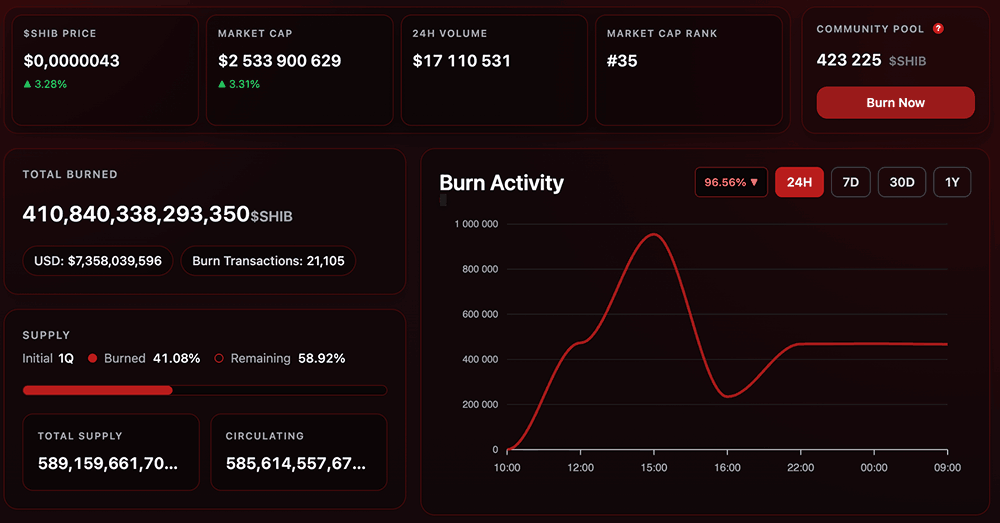
Shibburn, July 9, 2026
The problem is scale. If SHIB kept today’s supply and reached $1, its market cap would stand near $589 trillion. That number does not fit a realistic crypto market. To make $1 possible at a $100 billion market cap, SHIB supply would need to fall to about 100 billion tokens. That means the market would need to remove more than 589 trillion tokens from circulation, or roughly 99.98% of today’s supply. At a $50 billion market cap, supply would need to fall to about 50 billion tokens, which requires an even larger burn.
This is why the question “how much Shiba needs to be burned to reach $1” has a difficult answer. Small daily burns can improve sentiment, but they do not change the math fast enough. SHIB would need massive burns, strong demand, and a much larger crypto market at the same time.
Why Token Burns Are Not a Simple Solution
Token burns sound powerful because they reduce supply. However, burns only help price when demand stays the same or grows. If investors lose interest, a lower supply alone may not create a lasting rally. SHIB also needs real trading volume, stronger ecosystem use, and a market mood that supports risky meme coins.
The chances of Shiba Inu hitting $1 depend on more than burn headlines. For example, burning millions or even billions of SHIB can look impressive, but it remains small compared with a supply of hundreds of trillions. To change the long-term outlook, burns must continue at a huge scale for years. Because of that, burns can support SHIB, but they do not make $1 realistic in 2026.
Could Shiba Inu Ever Reach 1 Dollar?
Shiba Inu could reach $1 only under a very extreme long-term scenario. The issue is not the number “1” itself. The issue is the supply behind that number. CoinMarketCap lists SHIB near $0.000004276, with about 589.24 trillion tokens in circulation and a market cap close to $2.51 billion. At the same supply, $1 would value Shiba Inu near $589 trillion. That is why the question “will Shiba Inu ever reach 1 dollar” needs a market cap answer first.
For $1 to look even remotely realistic, SHIB would need a massive supply reduction. If investors accepted a $100 billion SHIB market cap, the supply would need to fall to about 100 billion tokens. That means more than 99.98% of today’s circulating supply would need to disappear. If SHIB kept 1 trillion tokens, a $1 price would still mean a $1 trillion market cap, which would put it in the same broad value zone as the largest assets in crypto history.
So, yes, $1 is theoretically possible in math, but it looks unrealistic in practice unless burns, demand, and adoption change on a scale the market has not seen yet. A more careful long-term view should treat $1 as a distant, low-probability idea, not as a normal forecast.
What Is a More Realistic SHIB Target?
A more realistic SHIB target should start with market cap, not dreams about $1. At a circulating supply of about 589.24 trillion tokens, SHIB would have a market cap near $5.9 billion at $0.00001, about $11.8 billion at $0.00002, and almost $29.5 billion at $0.00005. These levels would still require strong demand, but they sit much closer to normal crypto market logic than $1.
For beginners, a move from about $0.0000042 to $0.00001 would already mean a gain of roughly 130%. A move to $0.00002 would mean about 370%. A move to $0.00005 would mean about 1,000%. Those are large returns, even though they remain far below $1. They also show why investors do not need impossible targets to see meaningful upside.
This is why the question “will SHIB hit $1” can distract investors from more useful targets. Removing one zero would already represent a major rally. Removing two zeros would require a much stronger bull market, higher trading volume, and better demand for the Shiba Inu ecosystem.
Key Risks to Consider Before Following SHIB Predictions
SHIB predictions can look exciting, but beginners should treat them with caution. The first risk is volatility. Meme coins can rise quickly, yet they can also fall sharply when traders lose interest. A small change in market mood can move SHIB more than larger crypto assets.
The second risk is supply. SHIB has hundreds of trillions of tokens in circulation, so every higher target needs a larger market cap. This makes the road to $1 much harder than many social media posts suggest.
The third risk is hype. Influencers, viral posts, and price prediction websites often focus on upside because bold numbers attract attention. However, they do not guarantee demand. Investors still need to check volume, liquidity, market cap, burns, and wider crypto conditions.
The fourth risk is execution. Shiba Inu needs ecosystem growth, useful products, active development, and real users if it wants stronger long-term demand. Without that, SHIB may depend mainly on speculation. For that reason, no SHIB prediction should replace personal research or risk management.
FAQ
Will Shiba Inu Coin Reach $1?
Under current market conditions, this target looks extremely unlikely. SHIB still has hundreds of trillions of tokens in circulation, so a $1 price would require an enormous market cap. Without massive burns and much stronger demand, the $1 scenario remains unrealistic.
Will Shiba Inu Reach $1 in 2026?
A $1 price in 2026 does not look realistic. SHIB could still rise if the crypto market becomes stronger, but this target would require a market value far beyond normal meme coin levels. Investors should focus on smaller and more realistic price ranges.
Can Shiba Inu Coin Reach $1?
In theory, SHIB could reach $1 only if its supply fell dramatically and demand grew at an exceptional scale. In practice, the current supply makes this target very hard to support. Market cap math shows why beginners should treat $1 predictions with caution.
When Will Shiba Inu Hit $1?
There is no reliable timeline for SHIB reaching $1. Most predictions that mention this target depend on extreme assumptions about burns, demand, and future market growth. Unless SHIB removes most of its supply, $1 does not look realistic in the near or medium term.
Can SHIB Hit $1 If Most Tokens Are Burned?
This could become more realistic only if SHIB burned almost all of its circulating supply while keeping strong investor demand. Smaller burns can support sentiment and community interest, but they do not change the market cap math enough to make $1 realistic by themselves.
Is It Possible for Shiba to Reach $1?
In pure theory, yes. In real market terms, it looks highly unlikely. SHIB would need a much smaller supply, huge demand, and a market cap that fits global crypto liquidity. A more realistic view focuses on removing zeros rather than reaching $1.

Follow us on Medium, X, Telegram, YouTube, and Publish0x to stay updated about the latest news on StealthEX and the rest of the crypto world.
Don’t forget to do your own research before buying any crypto. The views and opinions expressed in this article are solely those of the author.
crypto meme crypto price prediction SHIB Shiba Inu ShibaSwapThe post Can Shiba Inu Reach $1 in 2026? first appeared on StealthEX.]]>

Understanding Altcoin Season
Definition of Altcoin Season
Many beginners wonder what altcoin season is and why it attracts so much attention from crypto investors.
Altcoin season is a market phase in which 75% or more of the top 50 cryptocurrencies outperform Bitcoin over a rolling 90-day period. Analysts use this benchmark to measure whether capital is flowing away from BTC and into alternative digital assets.
The term became widely known during the 2017-2018 bull market, when thousands of investors shifted profits from Bitcoin into Ethereum and smaller cryptocurrencies. As a result, many altcoins generated returns several times higher than BTC within a few months.
Historically, a full altcoin season has lasted between two and six months, although every cycle follows its own pace.
Outperformance simply means an altcoin delivers a better return than Bitcoin over the same period. For example, if Bitcoin gains 25% in 90 days while Solana rises 80%, Solana has outperformed BTC by a wide margin. When most leading cryptocurrencies achieve similar results, the market is generally considered to be in altseason.
The Bitcoin vs. Altcoins Dynamics: The ETF Wall
Bitcoin dominance represents the percentage of the entire cryptocurrency market that belongs to Bitcoin. When this metric starts falling, investors often interpret it as a sign that money is moving into altcoins.
However, the current market cycle differs from previous ones because of the so-called ETF Wall.
Spot Bitcoin ETFs launched by asset managers such as BlackRock and Fidelity have attracted billions of dollars from institutional investors. Unlike crypto traders, these investors usually gain exposure only to Bitcoin through regulated financial products, leaving that capital effectively locked inside the BTC ecosystem.
During the 2017 rally, retail money flowed much more freely into thousands of altcoins. In 2026, a broad altseason may require both Bitcoin profit-taking and a fresh wave of retail and on-chain liquidity before capital can spread across the wider market.
| Feature | Classic Cycle (2017–2021) | Institutional Cycle (2025–2026) |
| Primary Inflow | Retail / Fiat-to-Exchange | Institutional / Spot ETFs & RWA |
| Capital Flow | Linear: BTC → ETH → Large Caps → Small Caps | Fragmented: BTC → Specific Narratives (AI/DePIN) |
| The “ETF Wall” | Non-existent (capital flows freely) | High (ETF capital is “locked” in BTC/ETH) |
| Market Driver | Social Media / Pure Speculation | Real Utility / Enterprise Adoption / Layer 2 Growth |
How to Identify Alt Season
Recognizing alt season early can make a huge difference, as entering after the biggest rally often increases risk and limits upside potential.
The Altcoin Season Index & New 2026 Metrics
The Altseason Index is one of the most popular tools for tracking market rotation. Developed by Blockchaincenter, it uses a scale from 0 to 100 based on the performance of major cryptocurrencies against Bitcoin over the previous 90 days.
A reading below 25 signals Bitcoin season, while values between 25 and 75 suggest a mixed market. When the index rises above 75, the market is generally considered to be in altcoin season because most leading altcoins outperform BTC.

Altcoin Season Index, BlockchainCenter, June 10, 2026
However, the 2026 market requires additional confirmation. Many analysts now monitor the ETH/BTC and SOL/BTC trading pairs alongside the index. If Ethereum and Solana fail to gain strength against Bitcoin, an index reading above 75 may simply reflect temporary speculation rather than a sustainable market rotation. Strong performance from these benchmark pairs often confirms that capital is flowing beyond Bitcoin into the broader ecosystem.
| Index Value | Market Phase | Market Sentiment | Key Indicators (2026 Focus) |
| 0–25 | Bitcoin Season | Fear / Consolidation | BTC Dominance rising; ETH/BTC ratio at local lows |
| 25–75 | Mixed / Transition | Neutral / Anticipation | Capital rotation begins; Sector-specific rallies (AI, RWA) |
| 75–100 | Altcoin Season | Extreme Greed / FOMO | 75% of Top 50 alts outperform BTC; ETH and SOL breakout |
Key Indicators and Metrics
No single altcoin season indicator can predict the market with perfect accuracy. Instead, experienced investors combine several signals before concluding that a new rotation has begun.
One of the strongest indicators is Bitcoin dominance. A decline from above 50% toward 40% or lower often suggests that capital is leaving BTC and entering altcoins. At the same time, the total altcoin market capitalization should expand much faster than Bitcoin’s market value, ideally growing two to three times faster over the same period.
Trading activity also provides valuable clues. A week-over-week increase of more than 50% in altcoin/BTC trading volume usually signals rising investor interest. Social media engagement and Google Trends can reinforce this picture, especially when searches for terms like “best altcoins” or “altcoin season” increase by more than 30-50% within a few weeks.
When several of these indicators align, the probability of a genuine altseason becomes significantly higher than relying on the Altcoin Season Index alone.
Historical Altcoin Rally Patterns
Every major altcoin rally leaves valuable lessons behind, helping investors recognize repeating trends and avoid emotional decisions during future market cycles.
2017-2018 and 2020-2021 Bull Runs
Although both cycles produced extraordinary gains, the forces behind them were very different.
The 2017-2018 altcoin season was fueled by the ICO boom. Hundreds of new blockchain projects raised capital directly from retail investors, creating an environment where speculation often mattered more than fundamentals. As Bitcoin reached new highs and then slowed down, money rapidly rotated into smaller cryptocurrencies, causing many tokens to surge several hundred percent within months.
The 2020-2021 cycle followed a different path. Instead of ICOs, the market focused on DeFi protocols, NFT platforms, Layer 1 blockchains, and later meme coins. At the same time, institutional investors entered crypto through companies, funds, and regulated investment products, bringing significantly more capital than in previous years.
Retail investors still played a major role, especially during the NFT and meme coin frenzy, but institutional participation made the market larger and more mature. This shift also changed capital rotation, making leadership by Ethereum and key sectors more important than broad market speculation. As a result, future altcoin seasons may become increasingly selective rather than lifting every project at the same time.
Phases of Altcoin Season: From BTC to Narratives
The modern altcoin cycle is no longer a period where every token rises together. Capital now rotates from one narrative to another, rewarding sectors with the strongest adoption and momentum. Understanding these phases helps investors identify where money is flowing instead of chasing projects that have already peaked.
| Phase | Core Signal | Trending Sectors | Strategic Action |
| Pre-Season | BTC sideways, Alt/BTC pairs bottoming | Blue-chip alts (ETH, SOL) | Accumulate quality projects via StealthEX |
| Early Season | Sector-specific breakouts | AI, RWA, Layer 2 Solutions | Focus on leaders; avoid laggards |
| Peak Season | 100%+ gains in small caps | Meme Coins, New Launches | Take profits; move to stablecoins or BTC |
Pre-Season (Accumulation Phase)
The accumulation phase often begins while Bitcoin moves sideways or corrects by around 10-20%. During the same period, many altcoins fall another 20-40% from their local highs, causing retail interest to disappear.
Trading volume remains low, social media activity declines, and negative sentiment dominates discussions. Behind the scenes, experienced investors gradually accumulate projects with strong fundamentals at discounted prices.
This phase often ends when Bitcoin stabilizes, Ethereum starts outperforming BTC, and trading volume slowly returns. For long-term investors, this is usually the best time to research projects, build a watchlist, and accumulate positions before broader market attention returns.
Early Season: Narrative-Led Breakouts
Many investors ask, when does altcoin season start? In today’s market, the answer is often tied to narratives rather than market capitalization.
Instead of all top-ten cryptocurrencies rallying together, capital first flows into sectors attracting the strongest attention. AI agents, Real World Assets (RWA), and DePIN projects have recently become leading examples of this trend.
The traditional strategy of buying the largest altcoins simply because they rank in the top ten has become less effective. Early winners are increasingly projects with clear use cases, growing ecosystems, and strong investor narratives that attract fresh liquidity before the rest of the market reacts.
Peak Season (Maximum Activity)
The question is whether altseason becomes common when mid-cap and small-cap cryptocurrencies start gaining 100-500% within a few weeks. At this stage, optimism reaches extreme levels, and the Fear & Greed Index often climbs above 80.
While retail investors aggressively buy every market dip, experienced traders frequently begin distributing their holdings and securing profits. New token launches explode, leverage increases, and social media fills with unrealistic price predictions.
These conditions often serve as warning signs rather than buying opportunities. Rising volatility, excessive leverage, and parabolic price moves usually indicate that the market is approaching exhaustion. Historically, this peak phase lasts between two and six weeks before a sharp correction or a broader market rotation begins.
Trading Strategies for Altcoin Season
Successful altcoin investing depends on a clear plan. A structured strategy helps investors manage risk, protect profits, and avoid emotional decisions during volatile market conditions.
Portfolio Allocation & Sector Rotation
A balanced portfolio should match both your risk tolerance and market conditions. Conservative investors often allocate more capital to Bitcoin, Ethereum, and stablecoins, while aggressive traders increase exposure to high-growth sectors during strong market momentum.
Sector rotation is equally important. Capital rarely stays in one narrative for an entire cycle. For example, profits earned from AI-related projects can later move into RWA, DePIN, gaming, or other emerging sectors as investor attention shifts. Following liquidity instead of chasing past winners often produces better long-term results.
| Portfolio Style | BTC / ETH | Mid-Cap Alts (AI/RWA) | Small-Cap / Speculative | Risk Level |
| Conservative | 70% | 20% | 10% | Low–Moderate |
| Moderate | 50% | 35% | 15% | Moderate |
| Aggressive | 30% | 40% | 30% | High |
StealthEX: Cross-Chain Rotation in 2026
One of the biggest advantages during altcoin season is the ability to move capital quickly between ecosystems. New trends often emerge on different blockchains, and waiting too long can mean missing the strongest part of the rally.
StealthEX simplifies this process through instant cross-chain swaps. Instead of using multiple exchanges, bridges, and wallets, users can exchange Ethereum-based assets directly for trending tokens on Solana, Base, or many other networks in a single transaction.
This approach removes much of the complexity associated with traditional bridging solutions while allowing traders to react quickly as narratives change. For investors following sector rotation, fast cross-chain execution can become a significant competitive advantage during periods of high volatility.
Risk Management & Stop-Loss Discipline
Even the strongest altcoin season eventually comes to an end, making risk management one of the most important parts of any strategy.
Many experienced investors limit each position to 5-10% of their portfolio, reducing the impact of a single unsuccessful trade. Diversification across 8-12 carefully selected projects can further lower overall portfolio risk while maintaining exposure to multiple narratives.
Holding part of a portfolio in stablecoins also provides flexibility. Stablecoin reserves allow investors to buy quality assets during corrections and protect profits when market conditions become overheated. Combined with predefined stop-loss levels and profit targets, this disciplined approach often delivers more consistent results than trying to maximize gains on every trade.
Altcoin Season vs Bitcoin Season
Understanding bitcoin season and the transition to altcoin season helps investors recognize market rotation and adapt their strategy before capital changes direction.
Key Differences and Rotation Signals
The difference between altcoin season and BTC season comes down to where capital is flowing. During Bitcoin season, BTC dominance usually climbs above 50-60%, showing that investors prefer the market’s largest and most established asset. At the same time, many altcoins underperform or lose value against Bitcoin, even if their prices remain stable in dollar terms.
Altcoin season tells the opposite story. Bitcoin dominance often falls toward 40% or lower, while Ethereum and other major cryptocurrencies begin attracting more liquidity. This rotation can eventually spread to mid-cap and small-cap projects, creating the strongest gains of the cycle.
The investor profile also changes. Bitcoin season tends to attract conservative investors and institutions seeking lower volatility and long-term exposure. Altcoin season brings more speculative capital, with traders accepting higher risk in exchange for the possibility of significantly larger returns.
Historically, Bitcoin-led phases often last several months, while intense altcoin rallies may continue for only two to six weeks before momentum fades. Watching BTC dominance is therefore essential. If dominance starts rising again, stablecoin inflows increase, and leading altcoins begin losing strength against Bitcoin, these are often early signs that capital is rotating back into BTC or defensive positions, signaling the end of the altcoin cycle.
Expert Predictions and Future Outlook for the Altcoin Season
While every forecast remains uncertain, understanding predictions altcoin and their key catalysts can help investors build a smarter long-term strategy.
When Will the Next Altcoin Season Start
Many investors ask, when will altcoin season start, but no indicator can provide an exact date. Instead, successful predictions rely on a combination of macroeconomic conditions, Bitcoin’s market cycle, and capital rotation.
Historically, the strongest altcoin rallies have developed 18 to 30 months after a Bitcoin market bottom, often following a halving event. Since the latest Bitcoin halving took place in April 2024, many analysts believe the 2026-2027 period could still provide favorable conditions if liquidity continues improving.
Macroeconomic factors will play a major role. Lower interest rates, expanding global liquidity, and stronger investor risk appetite could encourage capital to flow into higher-risk digital assets. Institutional adoption may also support the market, although a significant share of investment remains concentrated in Bitcoin ETFs rather than altcoins.
Technology will likely shape the next cycle as much as macroeconomics. Narratives such as AI infrastructure, Real World Asset tokenization, DePIN, next-generation DeFi, and blockchain gaming could become the primary destinations for fresh capital. Rather than expecting every cryptocurrency to rally together, investors should focus on sectors attracting real users, developer activity, and institutional attention.
When Will Altcoin Season Start in 2026
The officially confirmed 2026 altcoin season has not yet begun, as Bitcoin currently accounts for approximately 56-60% of the total market capitalization. Analysts predict that a sustained shift toward altcoins will only occur if Bitcoin’s dominance falls below 50-55% and the Altcoin Season Index reaches the 75 threshold.
How to Prepare for the Next Altcoin Season
Preparing during quiet markets often creates better opportunities than reacting after prices have already exploded. A solid plan allows investors to act with confidence when momentum returns.
Building a Watchlist
The best watchlists focus on quality instead of quantity. Before adding a project, investors should confirm that it has a working product, active users, an experienced and publicly known development team, a reasonable valuation, and a strong community supporting long-term growth.
A practical research checklist should include token utility, ecosystem activity, developer updates, partnerships, liquidity, tokenomics, and competitive advantages. Reviewing these factors regularly makes it easier to separate lasting projects from short-term hype.
Organizing a watchlist by market capitalization, sector, and risk level also improves decision-making. Large-cap assets can provide stability, while smaller projects may offer higher upside with greater volatility. Updating the watchlist weekly and performing a deeper review each month helps investors stay prepared before capital rotates into new narratives.
Setting Up Your Trading Infrastructure
Strong infrastructure becomes a competitive advantage during fast-moving markets. Centralized exchanges usually provide deep liquidity and fiat access, while decentralized exchanges offer direct on-chain trading and access to newly launched tokens.
StealthEX combines many of these advantages by giving users access to more than 2,000 cryptocurrencies through instant swaps without mandatory KYC for standard transactions. Its cross-chain functionality also allows traders to move quickly from Ethereum assets into trending Solana, Base, or other ecosystem tokens without dealing with complex bridges.
Security should remain a priority regardless of platform choice. A hot wallet is useful for active trading, while a hardware wallet offers stronger protection for long-term holdings. Investors should also back up recovery phrases offline, enable two-factor authentication, verify wallet addresses before every transfer, and avoid storing large amounts of crypto on exchanges for extended periods.
Frequently Asked Questions
What Is the Current Altcoin Season Index Value?
The Altcoin Season Index’s current value can be checked in real time at Blockchaincenter. A score of 0-25 indicates Bitcoin season, 25-75 signals a mixed market, and 75-100 suggests altseason. Although the index updates daily, checking it weekly usually provides clearer signals and helps avoid overtrading caused by short-term market noise.
When Is Alt Season?
Many investors ask when alt season is, but there is no fixed date. Historically, major altcoin rallies have often appeared 12-18 months after a Bitcoin halving. While the latest halving took place in April 2024, market conditions, Bitcoin dominance, liquidity, and ETH/BTC strength remain more important than the calendar itself.
Can an Altcoin Season Happen if Bitcoin Is Crashing?
No. Broad altcoin seasons require Bitcoin to remain stable or trend higher. When Bitcoin falls more than 20% in a short period, capital usually leaves the entire crypto market instead of rotating into altcoins. Historically, major altcoin rallies have developed during Bitcoin consolidation or moderate uptrends, with only minor exceptions during small BTC pullbacks.
When Will Altcoins Pump?
The answer to when altcoins will pump usually depends on market rotation. Altcoins often accelerate after Bitcoin dominance peaks above 50-55% and starts declining while the ETH/BTC ratio strengthens. A 15-30% gain in ETH/BTC frequently precedes a broader rally, with capital gradually flowing from Ethereum into large-cap, mid-cap, and finally smaller altcoins.
Follow us on Medium, X, Telegram, YouTube, and Publish0x to stay updated about the latest news on StealthEX.io and the rest of the crypto world.
Don’t forget to do your own research before buying any crypto. The views and opinions expressed in this article are solely those of the author.
altcoin altcoin season altcoins Bitcoin what is altcoinThe post Altcoin Season Index: Complete Guide for 2026 first appeared on StealthEX.]]>

Best Cheap Crypto with Potential in 2026: Detailed Analysis
Investors who search for the cheapest cryptocurrency often ignore fundamentals. This section focuses on affordable coins with real value. Selection depends on strong technology, legitimate use cases, and expanding ecosystems. Each project trades on major exchanges, including StealthEX. The goal centers on value investing, not price chasing. Cheap tokens alone do not create opportunity. Sustainable networks with adoption and clear catalysts do.
| Crypto Name | Current Price | Market Cap | Category | Key Use Case | 2026 Catalyst |
| XRP | $1.5 | $91B | Payment Network | Bank cross-border settlement | SEC clarity, Ripple USD growth |
| ADA | $0.28 | $10B | L1 Blockchain | Smart contracts, DeFi | Chang upgrade, Hydra scaling |
| XLM | $0.17 | $5.5B | Payment Network | Remittances, tokenization | USDC expansion, partnerships |
| TRX | $0.28 | $26.5B | L1 Blockchain | Stablecoin transfers | USDT dominance, low fees |
| VET | $0.008 | $720M | Supply Chain | Enterprise logistics tracking | Global adoption programs |
| HBAR | $0.1 | $4.3B | Enterprise Blockchain | Tokenization infrastructure | Council expansion |
| ALGO | $0.09 | $850M | L1 Blockchain | DeFi, CBDC rails | State proofs rollout |
| GRT | $0.03 | $300M | Infrastructure | Blockchain indexing | Multi-chain growth |
| POL | $0.1 | $1.1B | L2 Scaling | Ethereum scaling | zkEVM adoption |
| ARB | $0.11 | $651M | L2 Scaling | Rollup infrastructure | DeFi ecosystem growth |
| SUI | $0.97 | $3.7B | L1 Blockchain | High-speed apps | Parallel execution expansion |
| FET | $0.17 | $400M | AI + Blockchain | Autonomous AI agents | Enterprise AI integration |
XRP (Ripple)
XRP trades around $1.5 in February 2026 with a market cap near $91B, which keeps it among the largest coins to invest in by liquidity and global reach. The project focuses on cross-border payments for banks and financial institutions. XRP solves a clear problem. Traditional international transfers stay slow and expensive. RippleNet allows institutions to settle transactions in seconds with minimal fees. The system uses ODL, or On-Demand Liquidity, which removes the need for pre-funded foreign accounts and reduces capital friction.
Ripple Labs leads development under CEO Brad Garlinghouse, while co-founder Chris Larsen remains a key strategic figure. The company maintains partnerships with major banks and payment providers across multiple regions. Recent milestones include the resolution of the long SEC legal dispute and the launch of the Ripple USD stablecoin, which expands ecosystem utility. The 2026 roadmap targets CBDC partnerships and institutional custody infrastructure. These upgrades may strengthen adoption and act as price catalysts if bank usage accelerates.
XRP behaves like financial infrastructure rather than a speculative token. Liquidity stays deep and access remains broad. Beginners can acquire XRP through non-custodial swaps on StealthEX without leaving funds on centralized exchanges. However, volatility still exists. Long-term value depends on real institutional adoption, regulatory clarity, and network usage rather than short-term hype.
Cardano (ADA)
Cardano trades near $0.28 in February 2026 with a market cap around $10B, which places ADA in the conversation about low cap crypto with large ecosystem potential. Cardano operates as a Layer 1 blockchain built for smart contracts and decentralized finance. The project aims to create a secure, scalable base layer using academic research rather than rapid iteration. Its Ouroboros proof-of-stake consensus reduces energy use while maintaining decentralization. This design attracts developers who prioritize long-term stability.
Charles Hoskinson founded Cardano, and Input Output Global continues to lead core development. The team follows a scientific review model, which separates Cardano from faster but less formal chains. Partnerships in Africa, including Ethiopia’s education credential system, show real-world experimentation. DeFi protocols continue to launch across the ecosystem, which increases on-chain activity. Recent upgrades include the completed Chang hard fork, the Hydra scaling layer going live, and the Midnight privacy sidechain entering production. These milestones expand performance and functionality.
The 2026 roadmap centers on governance maturity and DeFi total value locked growth. Institutional DeFi adoption and real-world applications may act as price catalysts if network usage expands. Beginners can buy ADA through non-custodial swaps on StealthEX while keeping custody of funds. However, ADA still follows market volatility. Long-term value depends on adoption, developer activity, and sustained ecosystem growth rather than short-term speculation.
Hedera (HBAR)
HBAR trades near $0.1 in February 2026 with a market cap around $4.3B, which keeps Hedera visible as a new crypto to invest in for investors who focus on enterprise infrastructure. Hedera does not use a traditional blockchain. The network runs on the Hashgraph consensus algorithm, which delivers high throughput above 10,000 transactions per second and extremely low fees. This architecture targets corporate environments that require speed, predictability, and compliance.
The Hedera Governing Council includes companies such as Google, IBM, Boeing, LG, and Deutsche Telekom. This structure distributes control across global organizations rather than a single foundation. Use cases already extend into asset tokenization, supply chain tracking, and carbon credit markets. Recent milestones include the DLA Piper tokenization platform and Shinhan Bank’s stablecoin pilot, which signal institutional experimentation on live infrastructure.
The 2026 roadmap focuses on a broader tokenization wave and the rollout of Smart Contracts 2.0 for advanced enterprise logic. Fortune 500 integrations and adoption announcements may act as price catalysts if real usage expands. Hedera positions itself as infrastructure for regulated industries rather than retail speculation.
Beginners can access HBAR through non-custodial swaps on StealthEX while keeping custody of assets. However, enterprise crypto still carries volatility. Long-term value depends on sustained corporate adoption, not hype.
The Graph (GRT)
GRT trades near $0.03 in February 2026 with a market cap around $300M, which places The Graph among infrastructure projects often discussed as a crypto with most potential in Web3 data services.
The Graph operates as a decentralized indexing protocol that allows developers to query blockchain data efficiently. Many describe it as a search engine layer for blockchains. Instead of scanning raw chains, applications pull structured data through subgraphs. These subgraphs support Ethereum, Polygon, Arbitrum, and other major ecosystems.
Co-founders Yaniv Tal and Brandon Ramirez built The Graph to solve a real developer bottleneck. Accessing blockchain data remains slow without indexing. Recent upgrades expanded multi-chain support to Solana, NEAR, and Cosmos. The protocol also integrates AI-powered query optimization, which improves efficiency as datasets grow. The 2026 roadmap targets more than 50 blockchain integrations and an AI agent data access layer. These upgrades align with the convergence between AI and decentralized infrastructure.
Demand for GRT scales with Web3 adoption. Every new decentralized application increases indexing needs. This structural demand may act as a long-term price catalyst if the ecosystem expands. Beginners can acquire GRT through non-custodial swaps on StealthEX while retaining custody. However, infrastructure tokens remain volatile. Value depends on sustained developer activity and DApp growth, not speculation.
Artificial Superintelligence Alliance (FET)
FET trades near $0.17 in February 2026 with a market cap around $400M, which places it among the best altcoins for next bull run discussions tied to AI infrastructure.
Artificial Superintelligence Alliance (prev. Fetch.ai) sits at the intersection of artificial intelligence and blockchain. The network deploys autonomous economic agents that use machine learning to perform tasks without human control. These agents support real-world scenarios such as supply chain optimization, automated DeFi trading, and smart city logistics. The goal centers on creating decentralized AI services that operate across industries.
CEO Humayun Sheikh leads development and focuses on enterprise adoption. Strategic partnerships include Bosch and Deutsche Bahn, which highlight industrial experimentation with AI agents. A major milestone arrived through the ASI Alliance merger with SingularityNET and Ocean Protocol. This union forms a combined AI ecosystem valued near $7.5B and expands shared infrastructure. The 2026 roadmap emphasizes enterprise AI agent deployments and a decentralized machine learning marketplace that connects developers and businesses.
FET benefits from the broader AI boom. Demand for decentralized compute and automation may act as a strong catalyst if enterprise partnerships scale. Integration within the ASI token framework also increases ecosystem visibility. Beginners can acquire FET through non-custodial swaps on StealthEX while maintaining asset control. However, AI tokens remain volatile. Long-term value depends on real adoption and usable technology, not hype.
How to Buy Low-Priced Cryptocurrencies Safely
Many beginners look for the cheapest crypto to buy without thinking about safety. Low-priced coins attract attention, yet secure purchasing matters more than entry cost. In 2026, investors use a mix of centralized exchanges, decentralized platforms, and instant swap services like StealthEX. Each option carries different risks. Hardware wallets protect long-term holdings. Users should avoid phishing links and always verify contract addresses before sending funds. Safe habits reduce costly mistakes.
Using StealthEX for Cheap Crypto Purchases
People who ask where to buy cheap crypto often want speed, privacy, and simplicity. StealthEX operates as a non-custodial instant exchange. The platform never holds user funds. Every swap runs wallet-to-wallet. This design removes exchange custody risk and reduces exposure to hacks. Users do not need registration or KYC. StealthEX supports more than 2,000 cryptocurrencies and over 100 fiat payment methods. Most swaps complete in under fifteen minutes depending on network conditions.
The process stays simple and beginner-friendly. First, go to StealthEX website and select the crypto pair you want to swap.

Second, enter your receiving wallet address.

Third, send the deposit transaction. Fourth, receive your coins directly in your wallet.

No account creation exists, and the platform stores no personal data. This structure increases privacy and limits attack surfaces. Integration partners can customize fees, while users choose between fixed-rate and floating-rate options depending on market preference.
StealthEX focuses on trust through transparency. Rates appear before confirmation, and the system locks fixed swaps during execution. Floating swaps adjust with market movement. Because StealthEX never controls private keys, users maintain full ownership at every step. That principle aligns with core crypto security philosophy.
Decentralized Exchanges (DEXs)
DEXs remain essential for new crypto coins to invest in because they list tokens before centralized exchanges.
- Uniswap dominates the Ethereum ecosystem.
- PancakeSwap offers low fees on BNB Chain.
- Raydium provides high-speed swaps on Solana.
- Aerodrome serves as the native liquidity hub on Base.
To trade, users connect wallets such as MetaMask, Phantom, or Rabby. The swap process is easy: connect wallet, select pair, approve token, set slippage between 0.5% and 2%, then confirm the transaction.
Gas fees vary by network congestion. Investors reduce cost by using Layer 2 networks when possible. DEX access brings opportunity but also risk.
- New tokens may lack audits.
- Rug pulls still occur.
- Impermanent loss affects liquidity providers.
Aggregators like 1inch and Jupiter help users find optimal pricing across multiple pools, yet risk never disappears.
| DEX Name | Supported Chains | Avg Gas Fees | Liquidity | Best For |
| Uniswap | Ethereum, L2s | $2–15 ETH / <$1 L2 | Very High | Established tokens |
| PancakeSwap | BNB Chain | <$1 | High | Low-fee trading |
| Raydium | Solana | <$0.1 | Medium | Fast swaps |
| Aerodrome | Base | <$1 | Growing | Base ecosystem |
| 1inch | Multi-chain | Variable | Aggregated | Best routing |
| Jupiter | Solana | <$0.1 | Aggregated | Solana routing |
Investment Strategies for Cheap Cryptocurrencies
Anyone searching for the best crypto to buy now should think about strategy before thinking about price. Cheap assets move faster than large caps, so position sizing and timing matter more than entry hype.
The 2026 market sits in a classic post-halving expansion phase. Historically, Bitcoin leads first, Ethereum follows, large-cap altcoins come next, and smaller coins move last. This rotation does not happen overnight, yet it repeats often enough to guide expectations.
Investors who chase late pumps usually carry the most risk, while investors who scale in early and manage size survive volatility better. Cheap crypto rewards patience, not impulse. Entry points matter, but timeframe matters more. A 12–18 month horizon fits the current cycle better than short-term speculation.
Portfolio Allocation Guidelines
People looking for a small crypto to invest often forget portfolio balance. Crypto should usually represent 5–10% of a total portfolio, not the entire strategy. Within that crypto portion, speculative low-cap plays should stay limited to 10–20% of the crypto allocation, which equals roughly 1–2% of total net worth. This structure forms a risk pyramid. The base layer holds Bitcoin and Ethereum at about 60–70% because they anchor stability. The middle tier includes established altcoins such as XRP, ADA, HBAR, and ALGO at 20–30%. The top tier contains higher-risk growth projects like GRT, FET, ARB, and SUI.
Diversification inside the cheap crypto segment also matters. Layer 1 chains behave differently from infrastructure tokens or AI protocols. Spreading exposure across sectors reduces single-theme risk. Conservative investors often stick to the top 20 assets and size positions smaller. Aggressive investors explore lower caps but accept deeper swings. The 2026 environment will likely remain volatile even in bullish phases, so position sizes should reflect emotional tolerance as much as financial capacity.
| Risk Level | % of Portfolio | Crypto Type | Example Projects |
| Conservative | 3–5% | Large-cap core | BTC, ETH |
| Moderate | 5–8% | Established alts | XRP, ADA, HBAR, ALGO |
| Aggressive | 8–10% | Emerging growth | GRT, FET, ARB, SUI |
| Speculative | ≤2% | Micro-cap bets | Early-stage projects |
Dollar-Cost Averaging (DCA)
For beginners searching for the best crypto to buy now, dollar-cost averaging offers one of the safest entry methods. DCA means investing a fixed amount at regular intervals regardless of price. Instead of trying to predict perfect bottoms, investors spread purchases across time.
This method reduces timing risk and smooths volatility. It also removes emotional pressure, which often leads to bad decisions during sharp drops. In a post-halving cycle like 2026, predicting exact tops and bottoms becomes nearly impossible, so consistency beats precision.
A simple example helps. Imagine investing $100 per month into XRP across four months while price swings up and down. The final average purchase price often lands lower than a single lump-sum entry. Over time, this effect compounds.
XRP DCA Example – 2026
| Month | Investment Amount | XRP Price | Tokens Purchased | Total Tokens | Total Invested | Portfolio Value | Average Cost |
| January 2026 | $100 | $0.6 | 166.67 | 166.67 | $100 | $100 | $0.6 |
| February 2026 | $100 | $0.45 | 222.22 | 388.89 | $200 | $175 | $0.51 |
| March 2026 | $100 | $0.55 | 181.82 | 570.71 | $300 | $314 | $0.53 |
| April 2026 | $100 | $0.5 | 200 | 770.71 | $400 | $385 | $0.52 |
| May 2026 | $100 | $0.7 | 142.86 | 913.57 | $500 | $639 | $0.55 |
Practical schedules vary by personality. Active traders may buy weekly, regular investors often prefer bi-weekly and long-term holders usually choose monthly automation. Many platforms support recurring purchases, which turns investing into a habit rather than a gamble. DCA does not eliminate risk, yet it builds discipline, and discipline matters more than perfect timing.
Frequently Asked Questions
What Is the Cheapest Cryptocurrency to Buy Right Now?
The phrase cheapest cryptocurrency to buy sounds simple, yet price alone misleads investors. A $0.1 token with 100 billion supply can carry a higher valuation than a $10 token with 100 million supply. Market capitalization, not token price, determines real size. Market cap equals price multiplied by circulating supply. That number shows how much value the market assigns to a project.
For example, February 2026 prices show XRP near $1.5, ADA around $0.28, XLM close to $0.17, HBAR near $0.1, and GRT around $0.03. GRT looks cheaper per coin, yet valuation depends on total supply. Investors should ask which project offers the best value, not the lowest sticker price. Prices also change every minute, so live data matters more than static numbers.
Which Crypto Has 1000x Potential?
The question which crypto has 1000x potential reflects lottery-style thinking, yet 1000x returns remain extremely rare. To reach that scale, a project must start as a micro-cap under $10 million and grow into a multi-billion ecosystem. That requires revolutionary technology, perfect timing, and massive adoption. The math alone explains the challenge. A $10M market cap growing to $10B demands global traction.
Historical examples exist. Bitcoin from 2011 to 2017 and Ethereum from 2015 to 2021 produced life-changing returns, but both required years of patience and brutal volatility. In the 2026 cycle, reframing expectations makes more sense. Established projects might deliver 5–10x in strong conditions. Early-stage networks with fundamentals could reach 20–50x. Investors should focus on risk-adjusted returns instead of miracle narratives.
Can Cheap Cryptocurrencies Make You Rich?
Yes, cheap crypto that will explode has created large fortunes before, but survivorship bias hides the failures. Solana rose from $1.5 in 2020 to $260 in 2021. Polygon climbed from $0.01 to $2.9 in the same cycle. These gains look spectacular, yet most cheap tokens never recover. More than 90% of 2017 ICO projects now hold little or no value.
High returns demand early entry, emotional resilience, and strategic profit taking. Crypto regularly produces 80–95% drawdowns, even during bull markets. Many investors sell at the bottom and miss the recovery. 2026 opportunities likely appear in AI, real-world asset tokenization, and Bitcoin Layer 2 ecosystems. However, none represent guaranteed wins. Cheap crypto investing resembles venture capital. A few winners offset many losers.
Which Crypto Coin Will Boom Next?
Predicting the next big crypto coin depends on broader market forces, not a single secret pick. Bitcoin dominance cycles, sector rotation, and narrative momentum shape performance. In 2026, attention grows around AI integration, real-world asset tokenization, restaking protocols, modular blockchains, and Bitcoin Layer 2 networks. Projects like FET, HBAR, and emerging infrastructure chains attract early interest because they align with these themes.
Investors should watch milestone calendars, whale accumulation patterns, and developer activity. GitHub commits, testnet launches, and partnership announcements often signal growth before price reacts. Community discussion on social platforms also reveals early traction. No signal guarantees success, but patterns appear when adoption accelerates.
What Is the Best Crypto to Buy Now?
The question of what crypto should I buy now has no universal answer because “best” depends on risk tolerance and timeframe. Conservative investors usually anchor portfolios around Bitcoin and Ethereum, which provide institutional stability. Moderate growth seekers often add established Layer 1 ecosystems such as SOL, AVAX, or SUI. Aggressive investors allocate small portions toward undervalued infrastructure tokens like GRT, FET, or ARB.
Diversification across categories reduces risk. A balanced February 2026 structure might place 60–70% in large caps, 20–30% in established alts, and no more than 10–20% in speculative positions. This content remains educational, not financial advice. Investors should research independently and consult professionals when necessary.
Are Cheap Cryptocurrencies Riskier than Bitcoin?
Yes. High risk high reward crypto assets carry substantially more danger than Bitcoin. Bitcoin volatility often ranges between 40–60% annually, while cheap altcoins can exceed 80–200%. Bear markets frequently produce 50–90% drawdowns in small caps. Liquidity also differs sharply. Bitcoin trades tens of billions daily, while smaller projects may handle only millions, which increases slippage and exit difficulty.
Scam rates remain higher among new tokens, and many projects fail completely. Bitcoin benefits from institutional ETFs, regulatory clarity, and deep infrastructure. Cheap cryptocurrencies lack that safety net and also face smart contract risks that can drain funds. These assets behave like speculative venture bets. Most portfolios should cap exposure at 10–20% of crypto holdings, or roughly 2% of total investments.
Conclusion
The best cheap cryptos attract investors because they lower the entry barrier and offer asymmetric upside. Small allocations can sometimes produce 10–100x returns, yet the same volatility creates real danger. The 2026 environment still rewards discipline more than excitement. Cheap crypto should never mean blind speculation. Strong decisions start with research focused on fundamentals, use cases, and ecosystem growth instead of hype cycles.
Diversification remains essential. Investors should spread exposure across sectors such as Layer 1 networks, infrastructure, AI, and DeFi rather than betting everything on one token. Secure purchasing also matters. Non-custodial platforms like StealthEX reduce custody risk and keep control in the user’s wallet. Strategies like DCA and careful position sizing help manage emotional swings. No investment should exceed what an investor can afford to lose completely.
Beginners benefit from starting small, often in the $50–200 range, while continuing education about blockchain technology and tokenomics. Monitoring 2026 catalysts such as halving cycle effects and regulatory shifts helps maintain context. Opportunities exist, but discipline separates long-term participants from short-term gamblers. This content serves educational purposes only, not financial advice. Cryptocurrency investing carries the risk of total loss.

Follow us on Medium, X, Telegram, YouTube, and Publish0x to stay updated about the latest news on StealthEX.io and the rest of the crypto world.
Don’t forget to do your own research before buying any crypto. The views and opinions expressed in this article are solely those of the author.
ADA best crypto cheap crypto XLM XRPThe post Best Cheap Crypto to Buy Now in 2026 first appeared on StealthEX.]]>

MicroStrategy Bitcoin
MicroStrategy began in 1989 as an enterprise business intelligence company. It built software that helped large organizations turn data into clear business decisions. This background matters because it explains what MicroStrategy was before Bitcoin became its main story.
In 2020, the company changed direction and started using Bitcoin as a treasury reserve asset. Over time, this move transformed it into Strategy Inc., often described as the first Bitcoin Treasury Company.
Strategy still runs its enterprise analytics and AI software business. Its software arm continues to generate steady revenue, including about $124 million in quarterly sales, which supports operations and gives the company more flexibility in capital allocation.
Michael Saylor: Net Worth and Bitcoin Vision
Michael Saylor is the public face of Strategy Inc.’s Bitcoin strategy. He studied aeronautics and astronautics at MIT, then co-founded MicroStrategy in 1989. In 2026, Michael Saylor’s net worth remains in the multi-billion-dollar range, but it moves sharply with MSTR stock and Bitcoin.
Saylor also disclosed personal holdings of 17,732 BTC, separate from Strategy’s corporate treasury. His core idea is simple: Bitcoin is not just a trade, but a digital property with fixed supply and global liquidity.
That worldview shapes his long-term valuation model. He believes scarce digital capital can protect wealth better than cash, especially when fiat money loses purchasing power over time. For beginners, this explains why Strategy keeps buying BTC instead of treating it as a short-term speculation.
How Much Bitcoin Does Strategy Inc. Own Today?
As of the latest public data, Strategy Inc. owns 847,363 BTC. That equals about 4.04% of Bitcoin’s fixed 21 million supply, which makes Strategy the largest public corporate Bitcoin holder by a wide margin.
The company has spent about $64.1 billion on BTC. Its average cost basis now sits near $75,651 per Bitcoin, so its unrealized result depends heavily on the live BTC price. This is why many investors watch Strategy as both a software company and a leveraged Bitcoin treasury.
| Metric | Current Value | Strategic Significance |
| Total BTC Holdings | 845,256 BTC | Makes Strategy Inc. the largest public corporate Bitcoin holder in the world. |
| Share of Total 21M BTC Supply | ~4.03% | Shows that Strategy controls over 4% of Bitcoin’s ultimate global supply cap. |
| Total Capital Deployed | $63.97 Billion | Represents the aggregate fiat capital converted into a long-term digital asset reserve. |
| Average Purchase Price | ~$75,680 per BTC | Reflects heavy and aggressive Bitcoin accumulation during the 2025–2026 cycles. |
| Primary Corporate Designation | Bitcoin Treasury Company | Shows the company’s shift from MicroStrategy to Strategy Inc., aligned with its core Bitcoin allocation model. |
Strategy’s Bitcoin Acquisition Timeline & Capital Stack Evolution
Strategy’s Bitcoin journey started on August 11, 2020, when MicroStrategy bought 21,454 BTC for $250 million. That first move answered the question: when did MicroStrategy start buying Bitcoin? It also created a new corporate treasury model.
After that, the company stacked BTC through bull and bear markets. It used cash, stock sales, debt issuance, and senior convertible notes to raise capital without relying only on operating profit.

Strategy, July 2026
In 2026, Strategy expanded this model with a major 42/42 Capital Plan. The plan targets $42 billion through common equity and another $42 billion through fixed-income and preferred instruments, including STRC.
This capital stack now works like a digital credit machine. Strategy uses MSTR equity, convertible notes, and preferred stock to fund Bitcoin purchases, while managing dilution, interest costs, and dividend obligations.
MSTR Stock vs. Bitcoin: Premium to NAV and Financial Leverage
MSTR is the Nasdaq-listed equity of Strategy Inc. For beginners asking what MSTR is, the simple answer is this: it is a stock that gives indirect Bitcoin exposure through a company with a very large BTC treasury.
However, MSTR does not move exactly like Bitcoin. Its price also reflects debt, preferred stock, software revenue, market sentiment, and the premium or discount to Net Asset Value. In strong markets, investors may pay extra for its leverage. In weak markets, that premium can shrink or even turn into a discount.
This makes MSTR a high-beta Bitcoin proxy. It can outperform BTC during rallies, but it can also fall harder during drawdowns. Spot Bitcoin ETFs offer cleaner tracking, while physical Bitcoin gives direct ownership.
| Feature / Metric | MSTR Equity (Strategy Inc.) | Spot Bitcoin ETFs (e.g., IBIT) | Physical Bitcoin (Spot) |
| Exposure Type | Leveraged Corporate Proxy | 1:1 Direct Price Tracking | 1:1 Direct Asset Ownership |
| Management Fees | 0% Expense Ratio | 0.20%–0.25% Annually | 0% Management Fees |
| Financial Leverage | Yes, Via Convertible Bonds | No | No, Unless Using Derivatives |
| Options/Derivatives Depth | High Liquidity & Volatility | Moderate To High Liquidity | Depends On Exchange Or Platform |
| Retirement Account Friendly | Yes, 401k / IRA Eligible | Yes, 401k / IRA Eligible | Usually Requires Specialized Self-Directed IRA |
The Corporate Treasury Strategy: Capital Architecture Risks
The MicroStrategy Bitcoin strategy starts with one simple belief: scarce digital assets may protect a corporate balance sheet better than cash. Strategy treats Bitcoin as long-term capital because fiat money can lose value when supply expands.
However, this model carries real risk. Strategy has heavy exposure to one volatile asset, so deep BTC drawdowns can pressure its stock price, credit profile, and investor confidence at the same time.
Its capital stack also creates fixed obligations. Preferred dividends, refinancing needs, and debt-market conditions matter, even if senior convertible notes do not create classic margin call triggers.
In mid-2026, Strategy sold 32 BTC to optimize liquidity and support its capital structure. The sale was tiny compared with its total holdings, but it showed that treasury flexibility now matters. Its $871 million cash cushion also became a key safety buffer.
How to Invest in Bitcoin Like Strategy Inc.
Strategy Inc. buys Bitcoin as long-term digital capital, not as a quick trade. Individual investors can use the same basic idea, but they should scale it to their own risk level and avoid overexposure.
A beginner can choose spot Bitcoin ETFs, direct BTC purchases, or self-custody. ETFs are simple, while direct ownership gives more control. However, self-custody also means you must protect your private keys.
StealthEX fits investors who want fast wallet-to-wallet swaps without creating an exchange account. It supports 2,000+ digital assets, offers fixed or floating rates, and sends crypto directly to your private wallet. To use it:
- Go to StealthEX and choose the crypto you want to exchange.
- Select BTC as the coin you want to receive.
- Enter the amount you want to swap and choose a fixed or floating rate.
- Paste your personal Bitcoin wallet address. Check it carefully, because crypto transactions cannot be reversed.
- Send your crypto to the deposit address shown by StealthEX.
- Wait for the network confirmation and the swap process.
- Receive BTC directly in your private wallet.
| Feature / Layer | Non-Custodial Swap (StealthEX) | Traditional Centralized Exchanges (CEX) |
| Registration / KYC | No registration typically required | Mandatory verification and personal data storage |
| Asset Custody & Security | Instant delivery to your private wallet | Funds held on exchange wallets, creating counterparty risk |
| Supported Assets | 2,000+ cryptocurrencies | Limited to exchange listings, usually 100–300 |
| Execution Flow | Fixed or floating rates, wallet-to-wallet | Order book matching, deposits, and withdrawal delays |
| Best Used For | Fast, private, secure portfolio rotation | Active day trading and margin speculation |
Frequently Asked Questions
What Does Strategy Inc. Do Besides Holding Digital Capital?
Strategy Inc. develops enterprise analytics and AI software. This core business generates roughly $500 million per year and helps cover operating costs while supporting its Bitcoin treasury model.
How Many Bitcoins Does Strategy Inc. Have in 2026?
Strategy Inc. holds about 847,363 BTC in 2026, equal to more than 4% of Bitcoin’s total 21 million supply. Check the detailed tracker section above for the latest holding data.
How Many Bitcoins Does Michael Saylor Own Personally?
Michael Saylor personally owns 17,732 BTC. These coins belong to his private holdings and remain completely separate from Strategy Inc.’s corporate Bitcoin reserves.
When Did the Company Execute Its First Bitcoin Transaction?
The company made its first Bitcoin purchase on August 11, 2020. It bought 21,454 BTC for $250 million. See the full acquisition timeline section above for more context.
Why Choose MSTR Equity Instead of a Spot Bitcoin ETF?
MSTR offers corporate financial leverage, high-beta Bitcoin exposure, and deep options liquidity. Spot Bitcoin ETFs provide cleaner 1:1 BTC tracking minus management fees. See the MSTR vs. Bitcoin section above.
Does Strategy Inc. Face Structural Liquidation or Margin Call Risks?
Strategy’s senior convertible notes are unsecured and do not include classic margin call triggers. However, the company still manages refinancing risk, dividend obligations, and liquidity with its $871 million cash cushion.
Follow us on Medium, X, Telegram, YouTube, and Publish0x to stay updated about the latest news on StealthEX.io and the rest of the crypto world.
Don’t forget to do your research before buying any crypto. The views and opinions expressed in this article are solely those of the author.
Bitcoin BTC invest in crypto investing investmentThe post Strategy Bitcoin: Complete Guide to the Largest Corporate BTC Holder first appeared on StealthEX.]]>

What Are Monero Faucets?
Generally, a crypto faucet is a website or program that pays you in cryptocurrency for doing simple tasks. These tasks could include watching an advertisement, taking a survey, or completing a quiz. Some Monero faucets do not even require you to accomplish tasks; all you need to do is show you are human by completing a captcha.
However, keep in mind that crypto faucets are dubbed ‘faucets’ because the incentives you receive are minuscule, much like the drops from the leaky kitchen faucet you’ve been meaning to replace for a week. If you’ve ever played an online game, you’ve likely encountered the concept of crypto faucets, albeit the payouts may not have been Monero. For example, when you run out of energy, life, jewels, or other in-game resources in an online game, you may be given the option of earning more by watching an ad or movie. Monero faucets use essentially the same mechanism.
Some Monero faucets are designed to raise knowledge and curiosity about a specific coin. Others are more of a straightforward company focused on ad revenue, similar to mobile internet gaming. Indeed, non-crypto and Web2 platforms (such as the web browser Brave) leverage crypto faucets to recruit users.
Criteria for Selecting the Best Monero Faucets
When using cryptocurrency faucets, users must prioritize security and remain attentive against scammers. The measures for ensuring safe use are simple and important to follow:
- Promises of high returns: Legitimate faucets only provide modest amounts of Monero. Offers with large returns are red flags.
- Transparency and security: Users should search for faucets with clear operating procedures. Hidden processes may reveal dishonest intentions.
- Reliability and payout frequency: The Monero faucet should preferably be reliable and trustworthy so that you wouldn’t have to wait for your payouts for long or guess where they are.
- Minimum withdrawal: It’s important that the minimum withdrawal of a Monero faucet isn’t too high. Otherwise, it can discourage you from working on receiving free XMR.
- User reviews and community feedback: Participating in community forums and examining feedback might assist spot scams. They should be aware of faucets that have received numerous poor ratings or have been reported for fraudulent behavior.
Best Monero Faucets to Earn Free XMR
You can earn XMR tokens through a number of different Monero faucets. However, which of these can be trusted? Here is a list of the top XMR faucets that pay.
FireFaucet
Firefaucet is a website where you can earn XMR and other altcoins for free. The site has been online since 2018 and has been established as one of the most successful and stable faucets online. The main difference with other sites is the unique design and that here you can automatically claim every currency (out of 9 currencies available) at once on the same page.

To get started, create an account with FireFaucet. Fill in your details, including a valid email address and password. Once registered, you’ll receive a confirmation email. Click the link to verify your account, and you’re all set.
To start earning from this tap, you must first gain Auto Claims. Auto Claims refers to the amount of times you can claim any money. For example, if you select five currencies, 5 Claims will be debited from your balance every minute. You can earn an unlimited Claim balance by solving Shortlinks, completing Offerwalls, and seeing advertisements. Your claim rates may vary depending on the options you’ve selected, such as payout increase and timer.
The minimum withdrawal amount on Firefaucet is quite modest, and your earnings can be paid to your FaucetPay wallets anytime. After registration, you can begin claiming by entering your FaucetPay wallet addresses or going directly to any address.
AllCoins
Another popular website where you can earn free XMR is AllCoins. AllCoins is a multi-cryptocurrency faucet that allows you to earn and redeem any of the 13 cryptocurrencies/tokens currently available. AllCoins, like most faucet sites that allow users to collect free cryptocurrency, relies on advertising revenue generated by visitors to their website. In exchange, AllCoins repays you a percentage in the cryptocurrency of your choice. Once you’ve reached the minimum withdrawal criteria for the cryptocurrency you’ve chosen, you can send it directly to your own wallet.

Once your account is registered, you will see your username and current level. As you continue to make claims, complete PTC ads, shortlinks, play games and offers you will see your levels and percentage multipliers increase over time. AllCoins has faucets and withdrawals available for Bitcoin, Dogecoin, Litecoin, Ethereum, Dash, Monero, BitcoinCash, IDA Token, Stellar Lumens, XRP, Tron, and Bittorrent Token.
Each cryptocurrency on AllCoins has a different minimum withdrawal threshold that you need to hit which you can find on the withdrawal page. Once you’ve reached that threshold for the coin you’ve been claiming or have exchanged then you can click withdraw, click the amount of the coin balance you have which will automatically adjust the withdrawal amount, and then click Withdraw.
Final Autoclaim
Final Autoclaim is a mobile and desktop platform that takes a novel approach to the typical crypto faucet by giving users multiple options to earn cryptocurrency. It’s been on the market since 2019. Final Autoclaim compensates you for your time and effort. Using the Autoclaim tool, you can automatically claim up to 74 different cryptocurrencies. Furthermore, you can specify where you wish to receive your coins, providing you with more control over your profits. You can easily earn $20 per month in passive income.

Earning DUTCHY Tokens can be done by performing activities, surveys, or playing games (including a free roll every 30 minutes). These tokens represent the cash (points) used in Final Autoclaim. You can convert your DUTCHY tokens to any cryptocurrency listed on the platform, or use them in PTC or banner advertising campaigns.
After registering and validating your account, you will just have to set your addresses by clicking on the Set Your Addresses button, then go to the dashboard page, select the coins that you want, choose your favorite payment method, and finally click on Start Autofaucet button.
A very good thing about Final Auto Claim is that it offers many payment methods. Every time you complete an earning opportunity on this site, you will earn a certain number of DUTCH tokens. You can then swap these tokens to various crypto because Final Auto Claim has its own trading platform.
Maximizing Earnings from Monero Faucets
Faucets offer the opportunity to earn small amounts of assets, and this option should not be considered a full-time job. However, try using many faucets to maximize the small profits that the Monero faucet provides. Compare how profitable it is for you regarding the time and effort required. Still, here are some points that can help you maximize your earnings from faucets:
- Sign up for multiple faucets: Sign up for different faucets to increase the number of tasks available.
- Regularity: Complete tasks regularly. Please note that many faucets have timers that allow you to earn rewards at specific time intervals.
- Referral programs: Take advantage of faucets’ referral programs by attracting new referral users.
- Searching for the best terms: Compare faucets and choose the ones that provide the best terms, bonuses, or lower withdrawal fees.
Security and Best Practices
Participating in possibilities to earn free Monero necessitates monitoring security and acceptable behavior. Here are some suggestions to help guarantee that your experience is safe and secure.
The most important suggestion is to limit your connection to respectable, well-established websites or activities. Remind yourself not to accept offers that appear too good to be true.
You should always choose a trustworthy and secure Monero wallet to store your profits. Hardware wallets are a potential solution for adding an extra degree of security. Upgrade your wallet software frequently to take advantage of the most recent security improvements and bug fixes. Monero wallets work well with mobile devices (Android and iOS) and desktop operating systems (Windows and macOS).
To reduce risk, investigate various ways to acquire Monero. This could include mining, engaging in airdrops, or completing assignments on reliable websites. Don’t focus solely on one platform or strategy.
In addition to this, make sure each account and wallet has a strong, unique password. You can also use a password manager to generate and store complex passwords. Turning on two-factor authentication will add an extra degree of security to your accounts. Remember that security should always come first while engaging in any cryptocurrency-related activity. Understanding the hazards and best practices is essential for having a safe and effective experience. Keep yourself updated on Monero and cryptocurrency security.
Conclusion
Monero faucets are intended to introduce newcomers to some free XMR while also raising awareness and adoption and boosting Monero’s ecosystem. Beginners can learn about cryptocurrency without putting any skin in the game. However, Monero faucets are not a miraculous way to achieve your ambition of becoming a millionaire. The tap rewards are usually minimal. Having said that, who doesn’t enjoy free stuff?
When dealing with cryptocurrency faucets, however, you must be attentive and take caution to avoid frauds and other harmful attempts to steal your funds. As much fun as it is to earn cryptocurrency by playing games, security should always be your top priority.
Working on Monero faucets can indeed be pretty exhausting, and the results can be a bit disappointing. In case you’d like to purchase some XMR without applying any effort, you can always use StealthEX crypto exchange.
How to Buy Monero?
You can swap XMR privately and without the need to sign up for the service. StealthEX crypto collection has more than 2,000 different coins and you can do wallet-to-wallet transfers instantly and problem-free.
Just go to StealthEX and follow these easy steps:
- Choose coins and amount you want to swap. For instance, BTC to XMR.
- Click the Start Exchange button.
- Provide the recipient XMR address to transfer your crypto to.
- Process the transaction.
- Get Monero into your wallet!

Follow us on Medium, X, Telegram, YouTube, and Publish0x to stay updated about the latest news on StealthEX and the rest of the crypto world.
Don’t forget to do your own research before buying any crypto. The views and opinions expressed in this article are solely those of the author.
earn crypto faucet Monero Monero wallet Monero XMRThe post Top Monero Faucets to Earn Free XMR: A Comprehensive Guide first appeared on StealthEX.]]>

The Bitcoin Rainbow Chart helps you see where BTC stands in its long-term cycle. It turns complex price data into simple color zones. Many traders use it to judge risk and timing. In this guide, you will learn how the model works, what each band means, and how to apply it in 2026. You will also discover how to combine it with StealthEX to trade with more confidence and clarity. So, let’s get started!
What Is the Bitcoin Rainbow Chart?
Definition and Basic Concept
The Bitcoin Rainbow Chart explanation starts with a simple idea. The model uses logarithmic regression to track Bitcoin’s long-term growth trend. In simple terms, logarithmic regression draws a curved line that follows how BTC has grown over many years. It adjusts for rapid early gains and slower later growth. Then, the chart places colored bands around that curve. These bands show when Bitcoin looks undervalued, fairly priced, or overheated.

Visual Representation and Color Bands
The Rainbow Chart Bitcoin layout usually includes 9 to 11 color bands. Cool colors like dark blue and green sit at the bottom. They signal fear or undervaluation. Yellow bands show neutral territory. Hot colors like orange and red appear at the top. They reflect excitement or possible bubbles. Each band represents a market sentiment zone. This design helps beginners understand complex price cycles at a glance.
Logarithmic Regression Model Fundamentals
The BTC Rainbow Price Chart uses a logarithmic scale instead of a linear one. A linear scale treats every dollar equally. Bitcoin does not grow that way. Early moves from $1 to $10 were massive in percentage terms. Log scale corrects this distortion. The regression model fits historical Bitcoin price data into a smooth upward curve. This approach highlights the multi-year trend and filters out short-term noise.
Rainbow Chart V2 Update (2022)
In 2022, developers released Bitcoin Rainbow Chart v2 with a completely new formula. The new version fits all available data through 2022. It reflects recent market corrections, so it looks less optimistic than the original V1. The updated model also supports zoom and scaling features. Both versions remain available online. Many analysts compare them to understand how assumptions changed over time.
How Does the BTC Rainbow Chart Work?
Mathematical Foundation and Logarithmic Scale
The Bitcoin Rainbow Chart formula relies on logarithmic scaling and regression math. A logarithmic price scale shows percentage growth, not fixed dollar steps. This approach fits Bitcoin’s explosive early growth and slower maturity phase.
The model calculates a base regression curve using historical BTC prices. Then it applies standard deviation layers above and below that curve. These layers create the colored bands. Each band reflects how far price moves from the long-term trend, which helps traders measure extremes.
Color-Coded Zones Breakdown
The Bitcoin Rainbow Price Chart clearly shows sentiment stages from bottom to top. At the lowest band, “Fire Sale” signals extreme undervaluation. Above it, “Buy” and “Accumulate” suggest strong entry zones. “Still Cheap” indicates early growth. “HODL” represents fair value.
Higher bands include “Is This a Bubble” and “FOMO Intensifies,” where optimism rises. Near the top, “Sell” warns of overheating. The final zone, “Maximum Bubble Territory,” marks peak euphoria and high correction risk.
| # | Color | Zone Label | Market Sentiment | Investor Action | Historical Context |
| 1 | Blue | Fire Sale | Extreme undervaluation; deep correction or panic selling | Aggressive accumulation; strongest risk/reward profile | Late 2014, late 2018, mid-2022 bear market bottoms |
| 2 | Blue-Green | Buy! | Early recovery phase; market stabilizing after capitulation | Strong buy opportunity; early cycle positioning | Transition zone after major crashes |
| 3 | Green | Accumulate | Fair value with emerging uptrend | Gradual accumulation; strategic long-term positioning | Often active 12–18 months before halving |
| 4 | Light Green | Still Cheap | Undervalued vs long-term trend; rising institutional participation | Continue accumulation; early institutional inflow phase | February 2026 correction (~$73K–$90K) |
| 5 | Yellow | HODL | Fair-to-slight premium; steady upward momentum | Hold positions; avoid premature profit-taking | Mid-cycle consolidation area |
| 6 | Light Orange | Is This a Bubble? | Speculative enthusiasm rising; media attention increasing | Partial profit-taking; increase caution | Often 6–12 months post-halving |
| 7 | Orange | FOMO Intensifies | Parabolic acceleration; retail inflow peaks | Reduce exposure; protect capital | Q3 2017, Q4 2020 media-driven rallies |
| 8 | Red | Sell! | Strong overvaluation; correction risk elevated | Take major profits; active selling | ~$19K (2017), ~$60K+ (2021) |
| 9 | Dark Red | Maximum Bubble Territory | Extreme euphoria; historically followed by >50% drawdowns | Exit positions; maximum risk zone | Nov 2013, late 2021 before 70–80% crashes |
Understanding the Rainbow Chart Color Bands
Red Zone (Maximum Bubble Territory)
The Bitcoin Rainbow Price Chart current zone turns red during extreme euphoria. In 2013, 2017, and 2021, price entered this band before major crashes. Media hype peaks. Retail FOMO dominates. Risk becomes very high.
Traders often take profits here. Interestingly, the October 2025 ATH at $126K did not fully reach the red zone. With Bitcoin now around $65,000, the model places price in a blue band, not in bubble territory.
Blue Zones (Accumulate/Buy Territory)
The Bitcoin Rainbow Chart’s current position in blue signals undervaluation. These zones appear during fear and heavy pessimism. In past cycles, long-term investors accumulated here before strong rebounds. Risk remains, but the reward potential improves. Blue bands historically offered attractive entry points. When price sits near this area, traders focus on gradual accumulation instead of short-term speculation.
Bitcoin Rainbow Chart History and Accuracy
Historical Performance Analysis (2011–2026)
The Bitcoin Rainbow Chart analysis shows strong historical alignment with major cycle turning points. In 2011 and 2015, BTC touched deep blue bands before long bull runs. In late 2013, December 2017, and April 2021, price entered red zones near cycle tops. The fourth BTC halving in April 2024 triggered renewed upside momentum. Bitcoin reached a new ATH of $126K in October 2025, yet it stayed below the extreme red band.
In February 2026, BTC corrected to roughly $65K, landing inside “Still Cheap” and “Accumulate” zones. Historically, the model identified major tops and bottoms with estimated accuracy above 70% across full cycles.
| Cycle | Key Event | Date | BTC Price | Rainbow Zone | Prediction Accuracy | Notes |
| 1 | Bear Market Bottom | Jan 2012 | ~$2 | Blue / Fire Sale | ✅ Accurate | Early data; limited historical sample |
| 1 | Bull Market Top | Nov 2013 | ~$1,150 | Above Dark Red | ⚠️ Exceeded Chart | Price temporarily broke above model band |
| 2 | 1st Halving | Nov 28, 2012 | $12.33 | Blue-Green / Buy | ✅ Accurate | Accumulation phase at halving |
| 2 | Bear Market Bottom | Jan 2015 | ~$170 | Blue / Fire Sale | ✅ Accurate | Strong accumulation signal confirmed |
| 2 | Bull Market Top | Dec 2017 | ~$19,783 | Dark Red / Max Bubble | ✅ Accurate | Price aligned precisely with upper band |
| 3 | 2nd Halving | Jul 9, 2016 | $651 | Green / Accumulate | ✅ Accurate | Pre-halving accumulation zone |
| 3 | Bear Market Bottom | Dec 2018 | ~$3,200 | Blue / Fire Sale | ✅ Accurate | Clear long-term buy signal |
| 3 | 3rd Halving | May 11, 2020 | $8,591 | Green / Accumulate | ✅ Accurate | Textbook cycle positioning |
| 3 | Bull Market Top | Nov 2021 | ~$69,000 | Dark Red / Max Bubble | ✅ Accurate | Entered extreme zone before 75% crash |
| 4 | Bear Market Bottom | Nov 2022 | ~$15,500 | Blue / Fire Sale | ✅ Accurate | Post-FTX oversold signal |
| 4 | 4th Halving | Apr 19, 2024 | ~$63,000 | Yellow / HODL | ✅ Accurate | Mid-cycle halving; no immediate blowoff |
| 4 | Bull Market Top | Oct 2025 | ~$126,000 | Red–Dark Red | ✅ Accurate | ATH aligned with upper sell/bubble zones |
| 4 | Correction | Feb 2026 | ~$73K–$90K | Still Cheap / Accumulate | ✅ Accurate | Post-ATH pullback into accumulation band |
Major Bitcoin Cycles Correlation
The Bitcoin halving Rainbow Chart closely follows Bitcoin’s four-year halving rhythm. Major bottoms often appear in blue bands shortly before or after halvings. Major tops tend to cluster near orange or red zones during peak hype phases.
However, each cycle shows diminishing returns. Early cycles reached deep red extremes. Later cycles, including 2025, peaked lower within the Rainbow structure. This pattern reflects market maturation and growing institutional participation.
How to Use the Bitcoin Rainbow Chart for Trading
Entry Point Identification Strategies
The Bitcoin Rainbow Chart live view helps traders plan entries with discipline. Many investors wait for blue or purple zones before building large positions. These areas signal fear and undervaluation.
In March 2026, Bitcoin trades inside the “Accumulate” zone. This area often favors gradual buying. Traders also use green bands for DCA strategies. They spread capital over weeks or months. Some apply zone-based allocation. For example, they invest 40% in blue, 30% in green, and smaller amounts in yellow.
Exit Point Timing Techniques
The Bitcoin Rainbow Price Chart current band can guide exit planning. Instead of selling everything at once, traders scale out gradually. They reduce exposure in yellow zones. They take stronger profits in orange zones.
If price enters red territory, many secure major gains. October 2025 offers a good case study. BTC reached $126K near upper bands. Traders who reduced positions in orange preserved profits before the 2026 correction.
Risk Management Applications
The Bitcoin Rainbow Chart current zone can shape risk decisions. In blue zones, traders may increase allocation but still control leverage. In neutral zones, they keep balanced exposure. In orange or red zones, they reduce position size. Some adjust stop-loss distances based on band volatility. Others rebalance portfolio weight between BTC and stable assets.
This structured approach limits emotional decisions and protects capital across full market cycles.
Bitcoin Rainbow Chart vs. Other Price Models
Stock-to-Flow Model Comparison
The Bitcoin Price Rainbow Chart differs from the Stock-to-Flow model in structure and assumptions. S2F focuses on scarcity. It links price to supply reduction after halvings. The Rainbow model focuses on long-term trend regression and sentiment zones.
Between 2024 and 2026, S2F projected much higher prices than reality. It overestimated post-halving acceleration. The Rainbow model stayed closer to actual movement. S2F works well in strong expansion phases but struggles during consolidation. Rainbow adapts better to gradual growth patterns.
Power Law Model Comparison
The Bitcoin power law Rainbow Chart comparison highlights mathematical differences. The Power Law model uses a long-term growth curve based on network expansion. It resembles logarithmic regression but applies stricter statistical fitting.
During the 2025 cycle, the Power Law model tracked price more closely than S2F. It adapted better to slower growth and market maturation. Rainbow remains more visual and sentiment-based, while Power Law emphasizes structural mathematical consistency.
Limitations and Criticisms of the Bitcoin Rainbow Chart
Past Performance Not Guaranteeing Future Results
The Bitcoin Rainbow Chart 2025 prediction relies entirely on historical data. It assumes that Bitcoin will continue following a similar long-term trajectory. If regulation, macro shocks, or structural demand shifts occur, the curve may fail.
A major paradigm change could break past patterns. The V2 recalibration in 2022 attempted to correct earlier optimism. Still, any regression model depends on assumptions about future growth behavior.
Market Maturity Considerations
The Bitcoin Rainbow Price Chart 2030 outlook raises questions about maturity. Bitcoin now trades with more institutional participation. Volatility from 2024 to 2026 declined compared to earlier cycles. The 2025 peak only reached the “Is This a Bubble?” band, while 2021 approached stronger extremes. Percentage gains also shrank.
This pattern suggests diminishing returns. If maturity continues, the model may require further recalibration to reflect slower expansion and tighter price ranges.
Where to Access the Bitcoin Rainbow Chart
Official Sources and Reliable Platforms
The Bitcoin Rainbow Chart Blockchaincenter version represents the original V1 model. You can find it at BlockchainCenter. The updated V2 model appears at RainbowChart by Bitbo and reflects recalibrated data through 2022.

RainbowChart by Bitbo
Bitcoin Magazine Pro also provides a structured visual version with added analytics. TradingView offers custom community scripts.
V1 remains useful for historical comparison. However, V2 fits recent market data better and aligns more closely with 2024–2026 price behavior.
Live Chart Tracking Tools
If you want the Bitcoin Rainbow Chart live today, several platforms update regularly. Some refresh daily, while others sync with real-time BTC feeds. TradingView allows alerts when price enters new zones. CoinCodex provides a live tracker with current band identification.
These tools help traders monitor transitions between “Accumulate,” “HODL,” and upper zones without manual calculation.
Advanced Bitcoin Rainbow Chart Analysis Techniques
Combining with On-Chain Metrics
The Bitcoin Rainbow Chart current status becomes more powerful when combined with on-chain data. Traders often layer MVRV ratio, NUPL, and exchange reserve trends on top of Rainbow zones.
MVRV shows whether holders sit in profit or loss. NUPL tracks unrealized gains across the network. Exchange reserves reveal supply pressure.
In March 2026, BTC trades in the “Accumulate” zone. At the same time, MVRV stays near neutral levels and exchange reserves decline. This confluence improves long-term entry confidence.
Market Sentiment Correlation
The Bitcoin Rainbow Chart’s current color often aligns with market psychology. In blue zones, the Fear & Greed Index usually shows extreme fear. Social media sentiment turns negative.
In green and yellow bands, sentiment stabilizes. During orange phases, optimism rises quickly. Red zones often coincide with extreme greed and viral hype.
Tracking sentiment alongside Rainbow bands helps confirm whether price action reflects rational growth or emotional excess.
Bitcoin Rainbow Chart and Market Cycles
Four-Year Halving Cycle Relationship
The Bitcoin Rainbow Price Chart 2025 reflects Bitcoin’s built-in halving rhythm. A halving cuts miner rewards in half. This event reduces the new supply. Historically, the price begins in blue zones before halving. After the fourth halving in April 2024, BTC moved from green into yellow bands. Momentum increased throughout 2024.
In 2025, BTC price climbed toward the upper orange zones and reached $126K in October. By March 2026, BTC corrected into “Accumulate” and “Still Cheap” bands. This movement shows how price often travels from blue to warmer zones within a single four-year cycle.
Bull Market Phase Identification
The Bitcoin Rainbow Chart price forecast becomes clearer when you track color progression. Bull markets usually start in blue or green bands. Price then accelerates into yellow. As optimism grows, BTC enters orange. Rapid vertical moves often happen here. The final phase may touch red if euphoria explodes.
During the 2024–2025 bull run, Bitcoin advanced steadily through green and yellow before peaking near upper orange. The chart visualized each phase without emotional noise.
Trading Bitcoin on StealthEX Using Rainbow Chart Insights
How StealthEX Simplifies Crypto Trading
StealthEX.io offers a simple and fast crypto exchange process. You do not need to create an account. The platform works as a non-custodial service, so you keep control of your funds. It connects to multiple liquidity providers to secure competitive rates.
This setup fits Rainbow strategies well. When the chart signals accumulation or profit-taking zones, you can act quickly. The clean interface reduces friction and helps beginners execute trades with confidence.
Implementing Rainbow Chart Strategies on StealthEX
The Bitcoin Rainbow Chart TradingView setup allows you to monitor zones externally while using StealthEX for execution. First, check the chart on BlockchainCenter, RainbowChart, or TradingView. Identify whether BTC sits in “Accumulate,” “HODL,” or upper bands. Then visit StealthEX to swap assets when conditions align with your strategy.
This workflow separates analysis from execution. It reduces emotional trading and enforces discipline based on predefined zone rules.
Step-by-Step Trading Guide with Rainbow Chart Timing
The Bitcoin Rainbow Chart current price in March 2026 sits inside the “Accumulate” band.
- Step 1: Verify the current zone using a trusted chart source.
- Step 2: Confirm that your long-term plan supports accumulation.
- Step 3: Open StealthEX and select the asset you want to exchange for BTC. Enter the amount and provide your Bitcoin wallet address.
- Step 4: Review the rate and confirm the transaction. Once completed, store BTC securely.

This structured process aligns timing with strategy and avoids impulsive decisions.
Frequently Asked Questions About Bitcoin Rainbow Chart
Is The Bitcoin Rainbow Chart Legit?
Many beginners ask what the Bitcoin Rainbow Chart is and whether it works. The model uses logarithmic regression and dates back to 2014. In 2022, developers released V2 with a recalibrated formula. It is a technical analysis framework, not a prediction machine. It helps visualize long-term cycles. However, it does not guarantee future results. Traders should treat it as guidance, not certainty.
How To Read Bitcoin Rainbow Chart?
To interpret the Bitcoin Rainbow Price Chart today, first locate the current BTC price on the chart. Cool colors like blue often signal undervaluation. Warm colors like orange and red suggest a higher risk. Green and yellow zones reflect fair value. In March 2026, Bitcoin trades around $65K inside “Accumulate” and “Still Cheap” bands. This placement historically favors long-term entries rather than aggressive selling.
What Is The Current Bitcoin Rainbow Chart Position In 2026?
The Bitcoin Rainbow Chart 2026 view shows BTC trading near $65,000 as of March 2026. After the $126,000 peak in October 2025, BTC corrected by almost 50%. The Bitcoin Rainbow Price Chart’s current zone now falls between “Accumulate” and “Still Cheap.” Historically, this area represents healthy consolidation within the broader post-halving cycle.
What Is The Difference Between Rainbow Chart V1 And V2?
The Bitcoin Rainbow Chart v2 introduced a new formula in 2022. It fits all historical data through 2022 and reflects lower long-term growth expectations. V2 appears less optimistic than V1. The original Rainbow Chart version often shows Bitcoin as cheaper compared to V2. Both remain available online, but V2 better matches the current market structure and reduced volatility.
Follow us on Medium, X, Telegram, YouTube, and Publish0x to stay updated about the latest news on StealthEX.io and the rest of the crypto world.
Don’t forget to do your own research before buying any crypto. The views and opinions expressed in this article are solely those of the author.
Bitcoin Bitcoin BTC Bitcoin price Bitcoin price prediction BTCThe post Bitcoin Rainbow Chart: A Complete Guide to Understanding BTC Price Trends first appeared on StealthEX.]]>

What Is Tether and What Does USDT Stand For?
If you are researching the Tether meaning, the simplest explanation is that Tether (USDT) is a cryptocurrency designed to track the value of the US dollar. It exists on blockchain networks and acts as a digital version of USD.
USDT stands for US Dollar Tether. Tether Limited introduced it in 2014 to create a bridge between traditional finance and the fast-growing crypto market.
Today, USDT is the largest stablecoin in the world and one of the most traded cryptocurrencies. Its stable value makes it a popular choice for payments, transfers, and crypto trading.
Is USDT a Stablecoin? How Tether Works (The 1:1 Peg)
Many beginners ask, “Is USDT a stablecoin?” Yes, it is. Unlike Bitcoin or Ethereum, USDT is designed to keep its price close to 1 US dollar, making it less volatile than most cryptocurrencies.
Each USDT token is intended to be backed by reserves with an equivalent value. When eligible customers deposit fiat currency with Tether, new USDT is minted and enters circulation.
When those tokens are redeemed for fiat, Tether burns them, permanently removing them from the supply. This mint-and-burn process helps maintain the token’s 1:1 peg with the US dollar over time.
What Is USDT Used For? Real-World Applications
If you are wondering what USDT is used for, the answer goes far beyond crypto trading. Millions of people use Tether every day because it combines the speed of blockchain with the stability of the US dollar.
Traders often move their funds into USDT during periods of market volatility to reduce risk without leaving the crypto ecosystem. It is also one of the most common base currencies for crypto-to-crypto trading pairs.
In countries with high inflation, many people hold USDT to help preserve purchasing power. Others use it for fast international transfers, sending money across borders without relying on traditional banks or expensive intermediaries.
Tether Market Cap, Price, and Liquidity
The Tether market cap exceeds $185 billion in 2026, making USDT the largest stablecoin in the world. Under normal market conditions, its price stays very close to $1 per token, reflecting its US dollar peg. Thanks to daily trading volumes that regularly reach tens of billions of dollars, USDT offers exceptional liquidity and remains one of the easiest digital assets to buy, sell, or transfer.
What Backs Tether? A Look into Reserves
Many beginners ask what Tether is backed by before using USDT. Today, Tether supports its stablecoin with a diversified portfolio rather than holding only cash. Its reserves primarily consist of US Treasury bills, cash and cash equivalents, money market funds, and other short-term liquid assets. The company also holds a smaller allocation of diversified investments.
To improve transparency, Tether publishes regular attestation reports that summarize its reserves and liabilities. Over the years, the company has gradually shifted away from a purely cash-backed model toward a portfolio focused on highly liquid cash-equivalent assets, aiming to strengthen stability while maintaining the 1:1 peg.
| Reserve Asset Category | Estimated Share (%) | Liquidity Status | Risk Level |
| US Treasury Bills | ~75%–80% | Daily / Instant | Extremely Low |
| Cash & Bank Deposits | ~10% | Instant | Low (Counterparty risk) |
| Money Market Funds & Repos | ~5% | Near-Instant | Low |
| Bitcoin & Gold | ~3%–5% | Highly Liquid | Moderate (Market volatility) |
| Secured Loans & Corporate Bonds | ~2% | Term-bound | Moderate to High |
Types of Tether Tokens: Which Chain Is USDT On?
If you are wondering what chain USDT is on, the answer is simple: Tether does not have its own blockchain. Instead, it operates as a multi-chain token across several popular networks, including
- Ethereum (ERC-20)
- Tron (TRC-20)
- Solana
- Avalanche
- BNB Chain
- Polygon
Each version represents the same USDT but offers different fees and transaction speeds. Tron is popular for low-cost transfers, while Ethereum provides broad DeFi compatibility. Solana and Avalanche focus on fast transactions, and BNB Chain and Polygon offer efficient alternatives for everyday payments and decentralized applications.
| Blockchain Network | Token Standard | Avg. Transaction Speed | Estimated Fees (2026) | Primary Use Case |
| TRON | TRC-20 | 1–3 minutes | Low ($1–$2) | P2P transfers, retail payments |
| Ethereum | ERC-20 | 3–15 minutes | High ($5–$20+) | High-volume DeFi, institutional trading |
| Solana | SPL | Under 10 seconds | Ultra-low (< $0.01) | Micro-transactions, instant swaps |
| Polygon | PRC-20 | 1–2 minutes | Very Low (< $0.10) | Layer-2 dApps, low-cost trading |
How to Use USDT: Wallet Setup and Safe Transfers
If you are learning how to use USDT, start by creating a compatible crypto wallet that supports your chosen network, such as ERC-20 or TRC-20. After setting up and securing your wallet, you can receive USDT by sharing your public wallet address.
Sending USDT is just as simple. Enter the recipient’s address, choose the correct blockchain network, and confirm the transaction. Before sending funds, always double-check the wallet address and network. Even a small mistake can send your USDT to the wrong destination, and blockchain transactions cannot usually be reversed.
Is Tether a Good Investment? Risks and Asset Evaluation
Many investors ask, is Tether a good investment? The answer depends on your goal. USDT is designed to preserve value, not generate long-term price gains like Bitcoin or other cryptocurrencies.
It works well as a trading buffer during market volatility and can be used to earn yield through selected DeFi platforms. Compared with holding physical US dollars, USDT offers faster transfers and easier access to crypto markets. It also competes with stablecoins like USDC, although each issuer follows a different reserve structure and transparency model.
| Feature / Metric | Tether (USDT) | Circle (USDC) | Traditional US Dollar (USD) |
| Primary Focus | Global trading liquidity & P2P | US institutional & DeFi compliance | Legal tender, traditional banking |
| Regulatory Status | Offshore compliance (BVI) | Strict US onshore compliance | Federal Reserve regulated |
| Audit Frequency | Big Four financial audits (2026) | Monthly independent attestations | Government backed |
| FDIC Insurance | No | No | Yes (Up to $250,000 in US banks) |
| Freeze Mechanism | Yes (Controlled by Tether Ltd) | Yes (Controlled by Circle) | Yes (via bank/court order) |
Risks, Controversies, and Regulatory Scrutiny
Although the Tether USDT price usually remains close to $1, the project has faced regulatory scrutiny over the years. Tether has settled investigations with the CFTC and the New York Attorney General, while reserve transparency has remained a topic of debate. Because USDT is centrally issued, Tether can freeze specific wallet addresses when required by law enforcement. During periods of extreme market stress, USDT has also briefly traded above or below its dollar peg before returning to normal levels.
How to Exchange Tether on StealthEX
Exchanging USDT Tether on StealthEX is quick and beginner-friendly. As a non-custodial instant exchange, the platform lets you swap crypto directly from your wallet without creating an account for standard transactions.
Just follow these simple steps:
- Visit StealthEX.io.
- Select USDT and choose the cryptocurrency you want to receive.
- Enter the amount you wish to exchange.
- Provide your destination wallet address.
- Send your USDT to the deposit address generated by StealthEX.
- Wait a few minutes and receive your crypto directly in your wallet.
With 2,000+ supported assets, competitive exchange rates, and no mandatory KYC for standard swaps, StealthEX provides a fast and convenient way to exchange crypto while keeping full control of your funds.
FAQ
If you are new to cryptocurrency, you probably still have a few questions about Tether and USDT. That is completely normal. Although USDT is one of the most widely used digital assets in the world, many beginners are unsure how it works, what makes it different from other cryptocurrencies, or how to use it safely.
The following FAQ section answers the most common questions in simple language. It covers everything from the meaning of USDT and blockchain networks to wallets, payments, and security, helping you better understand how the world’s largest stablecoin fits into the crypto ecosystem.
What Does USDT Mean and What Is Its Official Definition?
If you are wondering what USDT means, it stands for US Dollar Tether. It is a stablecoin designed to maintain a value close to one US dollar, making it a digital representation of USD on the blockchain. Many people also search for “USTD” or “ISDT,” but these are simply common misspellings that usually refer to the same USDT token.
What Is the Difference Between Tether ERC20 and TRC20?
When people ask what Tether USDT ERC20 is, they are referring to the Ethereum version of USDT. TRC20 runs on the Tron network and usually offers lower fees, often around $1-2 or less, while Ethereum gas fees can be much higher. ERC20 is widely used in DeFi, but you must always choose the correct network when sending funds.
Can Tether (USDT) Wallets Be Frozen by the Issuer?
If you are learning how to use a USDT wallet, it is important to know that USDT is centrally issued. Tether Limited can blacklist blockchain addresses and freeze tokens through its smart contracts when required to comply with law enforcement or combat illicit activity.
What Does USDT Mean for Payments, and Who Accepts It?
Understanding what USDT means for payment is simple: it acts as a digital dollar for fast global transactions. Many VPN providers, web hosting companies, freelance platforms, and online merchants accept USDT because it enables quick international payments without the delays and costs of traditional banking.
Follow us on Medium, X, Telegram, YouTube, and Publish0x to stay updated about the latest news on StealthEX.io and the rest of the crypto world.
Don’t forget to do your own research before buying any crypto. The views and opinions expressed in this article are solely those of the author.
cryptocurrency stablecoin Tether USD USDTThe post USDT Meaning: What Is Tether (USDT)? Stablecoin Guide first appeared on StealthEX.]]>
What Is a Stablecoin?
If you are wondering what a stablecoin is, the answer is simple. It is a cryptocurrency designed to keep a stable value instead of experiencing large price swings. Most stablecoins are pegged to fiat currencies such as the US dollar, making them a popular bridge between traditional finance and the crypto market.
Definition and Core Purpose
The stablecoin meaning refers to a cryptocurrency whose value is linked to a stable asset, usually maintaining a 1:1 peg with the US dollar. Its main purpose is to provide price stability in a highly volatile crypto market while preserving the speed, transparency, and accessibility of blockchain technology. As a result, users can transfer, store, and trade digital assets without constantly worrying about sudden price fluctuations.
How Stablecoins Work
Many beginners ask, how do stablecoins work? The answer depends on their design, but the goal is always the same: maintaining a stable value of around $1. Some projects rely on reserves that back every issued token, while others use smart contracts or automated supply-adjusting mechanisms. By balancing the relationship between reserves and circulating tokens, these systems help keep the peg stable and make stablecoins a reliable tool for payments, trading, and digital savings.
The 4 Types of Stable Coins: A Complete Breakdown
Understanding the different types of stablecoins makes it much easier to choose the right one. While people once divided stablecoins into three categories, the market has evolved significantly. In 2026, four major architectures dominate the industry, each offering a different balance between stability, decentralization, yield, and risk.
| Stablecoin Type | Collateral Backing | Top 2026 Examples | Main Advantage | Primary Risk |
| Fiat-Collateralized | Cash, US Treasury Bills | USDT, USDC, PYUSD | Highest price stability & deep liquidity | Centralization & account freezing risk |
| Crypto-Collateralized | Crypto assets in smart contracts | DAI, LUSD, FRAX | Fully decentralized & transparent | Capital inefficiency (requires over-collateralization) |
| Synthetic Dollar | Crypto + Short perpetual positions | USDe (Ethena) | Built-in native yield generation | Funding rate inversion under bear market stress |
| Algorithmic | Smart contract code & supply burning | UST (Historical) | High capital efficiency | High risk of a permanent “death spiral” collapse |
Fiat-Collateralized Stablecoins
The largest group of collateralized stablecoins is backed 1:1 by traditional financial assets such as cash and short-term US Treasury Bills. Every issued token is supported by reserves held by a centralized issuer, helping maintain a stable value close to one US dollar. This model offers excellent liquidity, simple mechanics, and broad acceptance across exchanges and payment platforms. However, users must trust the custodian that manages the reserves, and issuers can freeze addresses or comply with regulatory actions. The best-known examples include USDT, USDC, and PYUSD.
Crypto-Collateralized (Over-Collateralized)
DAI stablecoin and similar decentralized assets use cryptocurrencies locked inside smart contracts instead of fiat reserves. To protect the peg, users must deposit collateral worth more than the stablecoins they create, making the system over-collateralized. Legacy DAI pioneered this model, while LUSD and FRAX introduced modern variations with different collateral designs. The biggest advantage is strong censorship resistance because no central company controls the reserves. The main drawback is capital inefficiency, since maintaining stability requires locking more value than the tokens issued.
Synthetic / Delta-Neutral Dollars (Yield-Bearing)
The modern yield-bearing stablecoin model has gained popularity through projects such as Ethena’s USDe. Instead of relying on cash reserves, these protocols combine crypto assets with short perpetual futures positions to create a delta-neutral strategy that aims to preserve the dollar peg. Because the strategy generates returns from derivatives markets, holders can often receive native yield without traditional lending. This innovative design blends price stability with passive income, although its performance depends on market conditions and funding rates.
Algorithmic Stablecoins
Algorithmic stablecoins attempt to maintain their dollar peg by automatically expanding or reducing token supply through smart contract logic instead of holding reserves. Although this approach is highly capital efficient, it has largely fallen out of favor after the collapse of TerraUSD (UST) in 2022. Once confidence disappeared, its supply mechanism failed, triggering a devastating death spiral that erased billions of dollars in value. Today, the UST case remains a permanent reminder that algorithmic designs can carry significant structural risks.
Top Stablecoins to Consider in 2026
The top stablecoins differ in more than market capitalization. Each project follows a unique approach to regulation, transparency, liquidity, or yield generation, making some options better suited for trading while others fit long-term DeFi strategies.
| Asset | Primary Issuer | Target Audience / Use Case | MiCA Compliant (EU)? | Unique 2026 Feature |
| Tether (USDT) | Tether Limited | Global P2P, high-volume trading pairs | No (Friction on EU exchanges) | Backed almost entirely by US Treasury Bills; liquidity king |
| USD Coin (USDC) | Circle | Western institutional markets, DeFi | Yes (Fully approved in the EU) | Maximum regulatory compliance and clean public audit trail |
| USDS | Sky (formerly MakerDAO) | Passive income within the DeFi ecosystem | No (Decentralized protocol) | Successor to DAI; offers native savings yield via Sky Protocol |
| PayPal USD (PYUSD) | PayPal / Paxos | Mainstream retail and e-commerce | Yes (Via Paxos licensing) | Direct integration with traditional fintech and Venmo apps |
Tether (USDT): The Liquidity King
When comparing DAI vs USDT, the biggest difference is centralization versus liquidity. USDT remains the world’s largest stablecoin and the preferred choice for traders because it offers unmatched trading volume and availability across nearly every major exchange. Tether has also strengthened confidence by shifting its reserves to almost entirely US Treasury Bills while eliminating commercial paper exposure. Its global adoption is difficult to match, although MiCA regulations have created compliance challenges and reduced availability on some European platforms.
USD Coin (USDC): The Compliance Leader
The DAI vs USDC debate often comes down to regulation versus decentralization. Issued by Circle, USDC has become the benchmark for compliance thanks to its fully approved MiCA status in the European Union and its regular transparency reports detailing reserve holdings. These features have made it a preferred stablecoin for institutions, regulated financial products, and many DeFi protocols. For users who value legal clarity and transparency, USDC remains one of the strongest choices available.
USDS & Dai (Sky Protocol): The DeFi Evolution
The comparison of USDC vs DAI changed significantly after MakerDAO evolved into Sky Protocol during 2024 and 2025. The ecosystem introduced USDS as the upgraded successor to DAI, adding the Sky Savings Rate (SSR), which allows eligible users to earn native yield directly within the protocol. While DAI continues to exist as a legacy stablecoin and remains widely supported, Sky increasingly positions USDS as its long-term flagship product for decentralized finance and on-chain savings.
Other Notable Stablecoins (PayPal USD, FDUSD)
A complete stablecoins list should also include projects that target specific user groups instead of the entire market. PayPal USD (PYUSD) focuses on mainstream payments and retail adoption through PayPal, Venmo, Ethereum, and Solana integration, making digital dollars easier to use in everyday transactions. FDUSD, meanwhile, has built its reputation around deep exchange liquidity and trading efficiency, serving active traders who prioritize seamless transfers between spot and derivatives markets.
How to Choose the Right Stablecoin
There is no single answer to what the best stablecoin is, because the right choice depends on your goals. Some users value decentralization, others prioritize liquidity or regulatory clarity, while long-term holders may focus on earning yield. Understanding your priorities is the key to selecting the most suitable option.
| If Your Main Goal Is… | …Your Best Choice Is | Recommended Network | Why This Setup? |
| Active trading outside the EU | USDT | TRON (TRC-20) / Solana | It offers the deepest liquidity across most trading pairs with very low transaction fees. |
| Strict compliance or EU residency | USDC | Base / Solana | It is fully MiCA-compliant, faces lower delisting risk, and is widely supported by regulated platforms. |
| Beating inflation / Passive yield | USDe or USDS | Ethereum / Arbitrum | These assets are designed to distribute native yield directly to eligible holders. |
| Online shopping & retail payments | PYUSD | Solana | It creates a seamless bridge between Web3 and the PayPal ecosystem for everyday payments. |
Regulatory Compliance and Geography (MiCA)
Your location can significantly influence which MiCA stablecoin is the most practical choice. If you live in the European Union, MiCA-compliant assets such as USDC generally face a lower risk of delisting from centralized exchanges and benefit from stronger regulatory support. Outside the EU and the United States, however, USDT continues to dominate global peer-to-peer markets and international trading thanks to its unmatched liquidity and broad acceptance across crypto platforms.
Liquidity vs. Yield-Generation
Not every stablecoin serves the same purpose. USDT and USDC are ideal for traders who need a stable parking place for capital before entering or exiting positions because they offer exceptional liquidity and broad exchange support. In contrast, yield-bearing assets such as USDe and sUSDS target long-term holders who want their digital dollars to generate passive returns. The trade-off is additional complexity and exposure to protocol-specific risks in exchange for potential yield.
Decentralization vs. Centralization
Choosing between centralized and decentralized stablecoins means balancing convenience against independence. Centralized issuers usually provide the highest liquidity, simple user experience, and reliable reserve management, but they also introduce a single point of failure and the possibility of account freezes or regulatory intervention. Decentralized and synthetic alternatives reduce censorship risk and remove reliance on a single company, yet they depend on smart contracts, protocol design, and market conditions that can create additional technical and funding-related risks.
Are Stablecoins Safe? Understanding Risks
Many people wonder, are stablecoins safe? In general, stablecoins are less volatile than most cryptocurrencies because they aim to maintain a value of around $1. However, that does not mean they are risk-free.
The word “stable” refers to price stability, not guaranteed safety. Every stablecoin relies on a different mechanism, and understanding how it works is essential before using or investing in it.
Depegging, Reserves, and Smart Contracts
When looking for the safest stablecoin, it is important to understand what can go wrong. A stablecoin can temporarily lose its $1 peg if confidence in its reserves or protocol weakens. Fiat-backed stablecoins carry counterparty risk because users depend on the issuer to manage reserves properly.
DeFi stablecoins rely on smart contracts, which may contain vulnerabilities or become targets for exploits. Synthetic dollars introduce another layer of risk, as long periods of negative funding rates can reduce the effectiveness of their yield-generating strategies and put pressure on the peg.
How to Diversify Your Stablecoin Holdings
Many investors ask which stablecoin is the safest, but a diversified approach is often the better solution.
Instead of keeping all your funds in one stablecoin or on one blockchain, consider spreading your exposure across multiple assets. For example, USDT or USDC can provide excellent liquidity for trading and payments, while decentralized or yield-bearing options can add diversification and income potential.
Your ideal allocation should always reflect your personal risk tolerance, investment goals, and preferred level of complexity.
FAQ
Bitcoin vs. Stablecoin: What Is the Fundamental Difference Between Them?
The main difference in bitcoin vs stablecoin is volatility. Bitcoin has a freely changing market price and a fixed supply, while a stablecoin is designed to maintain a 1:1 peg with a fiat currency such as the US dollar, making it suitable for payments, trading, and storing value.
What Is the Point of Stablecoins If Their Prices Do Not Increase?
The answer to what is the point of stablecoins is simple: utility. Stablecoins help users lock in profits without converting to a bank account, transfer money globally within minutes, and protect purchasing power from local currency volatility or inflation.
How Many Stablecoins Are There in the Crypto Market, and Are They All the Same?
If you are wondering how many stablecoins there are, the answer is hundreds. However, they are not all the same. They use different backing mechanisms, and the largest five stablecoins account for well over 90% of the market’s total liquidity.
How Do Stablecoins Work to Ensure Their Price Stays Exactly at $1?
To understand how stablecoins work, start with their backing mechanism. Issuers or protocols maintain reserves or collateral to support the peg, while market participants help keep the price close to $1 by buying or redeeming tokens whenever meaningful price differences appear.
Follow us on Medium, X, Telegram, YouTube, and Publish0x to stay updated about the latest news on StealthEX.io and the rest of the crypto world.
Don’t forget to do your own research before buying any crypto. The views and opinions expressed in this article are solely those of the author.
DAI stablecoin Tether USDC USDTThe post Stablecoins Explained: Which to Choose? first appeared on StealthEX.]]>
Bitcoin shows mixed signals as it trades near $65,000, holding key support while struggling below resistance. Recent drops, including a fast intraday sell-off and a broader ~50% decline from 2025 highs, highlight volatility. However, strong rebounds and institutional demand suggest recovery potential. In this guide, you will learn key levels, crash triggers, and actionable strategies for navigating the current market.
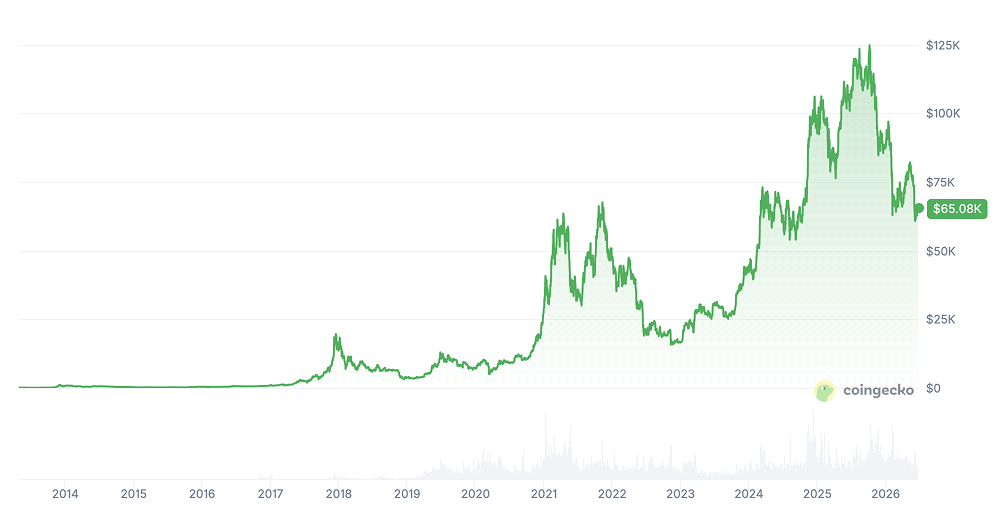
CoinGecko, June 22, 2026
Bitcoin Technical Analysis Today: Price Action Breakdown
Bitcoin technical analysis currently highlights a market at a critical turning point. Bitcoin is trading near $65,000, while several key technical indicators on the daily and weekly timeframes continue to signal bearish pressure. Traders are closely monitoring whether BTC can hold above major support zones or regain momentum toward higher resistance levels.
The daily and weekly charts remain the primary focus for market participants because they provide a clearer picture of the broader trend. With Bitcoin trading well below its 2025 all-time high, support levels around the recent lows and resistance near the mid-$60,000 range are becoming increasingly important. By combining price action, moving averages, and momentum indicators, traders can better assess potential breakout or breakdown scenarios and manage risk more effectively.
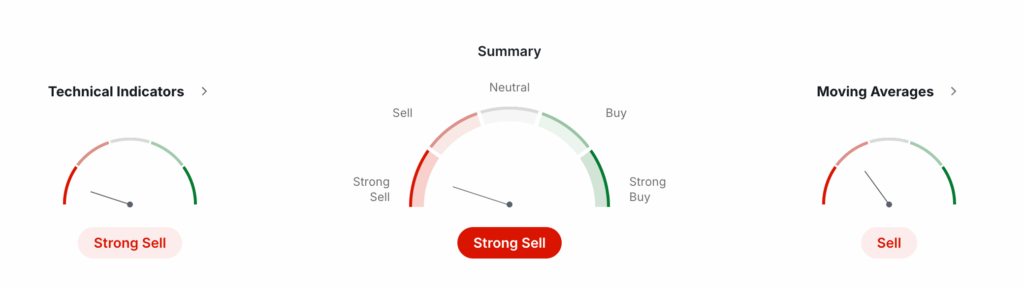
Monthly technical analysis from Investing.com, June 22, 2026
BTC Support and Resistance Levels
Understanding BTC support and resistance levels helps you spot where price may react. These zones form from volume clusters, past consolidations, and repeated tests. Here are support and resistance monthly data from Investing.com.
| Level Type | Price Point (USD) | Technical Rationale |
| Primary Resistance | $86,587 | Classic R2 pivot level |
| Immediate Resistance | $80,123 | Classic R1 pivot level |
| Pivot Level | $76,327 | Classic pivot point (key equilibrium zone) |
| Immediate Support | $69,863 | Classic S1 pivot level |
| Strong Support | $66,067 | Classic S2 pivot level |
| Current Price | ~$65,000 | Trading between S2 and S3 levels |
| Critical Support | $59,603 | Classic S3 pivot level |
Bitcoin continues to react to established support and resistance levels, as traders concentrate their buy and sell orders around these zones. Resistance areas typically signal stronger selling pressure, while support levels attract demand and can help stabilize price action. Currently, the region around $60,000 serves as a critical support zone. A decisive break below this level could weaken the market structure and increase the risk of a deeper correction, while holding above it would support the broader bullish outlook.
Chart Patterns and Price Structures
Current Bitcoin price action points to a period of consolidation as the market stabilizes around the $65,000 level. Rather than establishing a clear directional trend, BTC is trading within a defined range, suggesting that buyers and sellers remain in balance while the market searches for its next catalyst.
A bullish breakout above key resistance levels could open the door for a move toward the $70,000–$75,000 region, especially if accompanied by rising trading volume and sustained buying pressure. Confirmation would come from a series of higher lows and a strong daily close above resistance. On the downside, a break below the $60,000 support zone could weaken market sentiment and increase the likelihood of a deeper correction, shifting the short-term outlook in favor of the bears.
Bitcoin Market Update: Crash Analysis
The current Bitcoin market update shows that recent crashes were sharp but short-lived. On February 5, 2026, Bitcoin dropped around 20% in one week, falling toward the mid-$60,000 range due to massive liquidations and leverage unwinding. Shortly after, the broader cycle decline deepened, with BTC falling over 50% from its $126,000 peak to near $60,000.
More recently, on June 5, 2026, Bitcoin fell again after touching $59,100, driven by profit-taking and geopolitical tension impacting risk assets.
Despite negative headlines, strong institutional demand helped stabilize the market. Notably, ETF inflows of $53M absorbed selling pressure, which explains why the crash quickly turned into consolidation instead of a prolonged downtrend.
| Metric | Recent Value | Market Impact |
| Spot ETF Daily Flow | +$53 Million | Strong recovery after geopolitical shock |
| Exchange Reserves | ~2.7M | Supply shock – less BTC available for sale |
| Whale Net Change | +12k BTC (7-day) | Accumulation by large holders (1k+ BTC wallets) |
| Short Liquidation Risk | High above $67k | Potential short squeeze if resistance breaks |
Bitcoin Price Recovery Analysis and Bullish Signals
The current Bitcoin price recovery analysis shows a pattern similar to previous cycles. After sharp corrections, Bitcoin often recovers within 4–12 weeks, especially when strong demand appears. Right now, the market forms higher lows, which signals growing buyer strength.
At the same time, exchange outflows remain high, meaning investors move BTC into cold storage instead of selling. In addition, whale accumulation continues, with large holders increasing positions during dips. Finally, ETF inflows support the trend, as institutional capital absorbs selling pressure.
Recovery Roadmap: Price Targets
The Bitcoin price recovery forecast 2026 depends on how price reacts to key resistance levels. In the short term (1–4 weeks), Bitcoin may target $80,000–$85,000 if momentum builds above resistance. Over the medium term (1–3 months), a move toward $90,000–$100,000 becomes possible in a base scenario. In a bullish case, strong inflows and breakout structure could push BTC toward $110,000+. However, a bearish scenario appears if price loses support, which could send BTC back to $60,000–$59,000.
| Indicator | Current Status | Market Signal |
| MA50 | $59,249 (Buy) | Support – Long-term trend remains bullish |
| RSI (14) | 43.095 (Sell) | Weak Trend – Market lacks strong direction |
| MACD (12,26) | 2739.9 (Buy) | Positive – Early bullish momentum building |
| Stoch RSI (14) | 0 (Oversold) | Reversal Signal – Potential bounce zone |
| ADX (14) | 28.413 (Neutral) | Neutral – No strong momentum in either direction |
| Bull/Bear Power | -27,188.4 (Sell) | Bearish Pressure – Sellers still active |
Bitcoin Trading Strategy for Current Conditions
A strong Bitcoin trading strategy starts with patience and clear levels. Right now, traders focus on accumulation near support zones such as $69,000–$66,000, where demand historically appears.
Instead of entering all at once, many investors use a dollar-cost averaging (DCA) approach, which spreads entries over time and reduces risk. In addition, smart position sizing helps protect capital, so traders avoid overexposure in volatile conditions.
Risk management remains essential, therefore placing a stop-loss below key support, for example under $66,000, limits downside. At the same time, waiting for confirmation above resistance improves entry quality.
How to Trade Bitcoin Volatility with StealthEX
StealthEX allows users to trade Bitcoin quickly and without complexity. The platform offers no registration, which means you can start instantly without KYC. In addition, users benefit from competitive rates, fast transaction processing, and access to 2000+ cryptocurrencies. The process stays simple and clear.
- Visit the StealthEX website.
- Select BTC and the desired trading pair.
- Enter the amount and check the rate.
- Provide your Bitcoin wallet address.
- Send funds to the generated address.
- Receive Bitcoin directly in your wallet.
Conclusion
Bitcoin holds above key support at $66,000, which keeps the bullish structure alive despite recent volatility. Resistance near $80,000–$86,000 still blocks further upside. However, strong ETF inflows and steady accumulation suggest growing demand. Therefore, the market now shows consolidation, not collapse. Traders should stay cautious and manage risk.
Frequently Asked Questions
Below you will find answers to the most common questions about current Bitcoin market conditions and price behavior.
Why Is Bitcoin Falling?
Bitcoin is falling due to a mix of short-term factors. Recent declines followed profit-taking after rallies, combined with geopolitical uncertainty and market-wide risk-off sentiment. In addition, technical rejection near resistance triggered liquidations. The drop reached double-digit percentages in recent weeks, however it still looks like a short-term correction rather than a long-term reversal.
Is Bitcoin Crashing?
A true crash usually means a decline of 30–50% in a short time with panic selling. Bitcoin already dropped around 50% from its peak, but the current structure shows stabilization. Therefore, the latest move looks more like a correction within a larger cycle, not a fresh crash phase.
Is It a Good Time to Buy Bitcoin?
The answer depends on your strategy. Bitcoin trades close to key support zones, which often attract buyers. At the same time, indicators show mixed signals, so timing matters. Long-term investors may consider gradual accumulation, while short-term traders should wait for confirmation. Risk tolerance and timeframe play a key role in this decision.
Is Bitcoin in a Bear Market 2026?
A bear market requires a clear downtrend with lower highs and lower lows. Currently, Bitcoin still forms higher lows, which suggests consolidation rather than a full bear market. In addition, long-term moving averages remain bullish, which supports the broader uptrend.
What Is Happening with Bitcoin Today?
Bitcoin trades around $65,000, with a 24-hour gain of 1%. The market tests resistance near recent highs, while support remains below.
Make sure to follow StealthEX on Medium, X, Telegram, YouTube, and Publish0x to stay updated about the latest news on StealthEX and the rest of the crypto world.
Don’t forget to do your own research before buying any crypto. The views and opinions expressed in this article are solely those of the author.
Bitcoin Bitcoin BTC Bitcoin price prediction BTC BTC price predictionThe post Bitcoin Price Forecast: Critical Support Levels, Market Crashes & Recovery Patterns first appeared on StealthEX.]]>