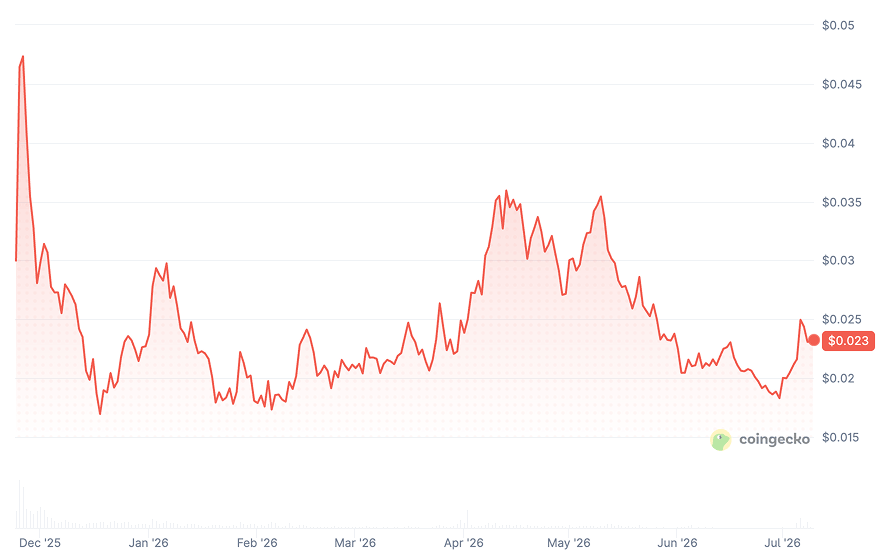
CoinGecko, July 9, 2026
Such price swings often appear in early-stage blockchain ecosystems. They reflect both hype and uncertainty. Investors now ask whether Monad can stabilize and grow. Others question if the rally already peaked. These debates shape current sentiment around MON.
This article examines Monad from multiple angles. We review the project’s structure and purpose. We analyze historical price action. We explore long-term forecasts through 2050. We also study expert opinions and technical signals. In addition, we explain what factors move the MON price.
The goal is not prediction certainty. Crypto markets remain unpredictable. However, structured analysis improves decision-making. Understanding context matters more than chasing hype. MON may represent opportunity, risk, or both depending on timing.
| Current MON Price | MON Price Prediction 2026 | MON Price Prediction 2030 |
| $0.023 | $0.03 | $0.06 |
Monad (MON) Overview
Monad is a high-performance Layer 1 blockchain launched on November 24, 2025. The network targets Ethereum’s biggest limits, which include slow throughput and expensive gas fees. Monad remains 100% EVM compatible, so developers can migrate Ethereum applications without rewriting code. This compatibility removes friction and accelerates ecosystem growth.
Performance defines Monad’s identity. The chain targets 10,000 transactions per second. Block finality reaches about 0.8 seconds. Average gas fees stay near $0.001 per transaction. By comparison, Ethereum transactions often cost between $0.50 and several dollars. This efficiency opens doors for payments, gaming, and high-frequency decentralized finance.
MON Price Statistics
| Current Price | $0.023 |
| Market Cap | $275,456,601 |
| Volume (24h) | $46,831,116 |
| Market Rank | #106 |
| Circulating Supply | 11,825,165,000 MON |
| Total Supply | 100,682,925,000 MON |
| 1 Month High / Low | $0.026 / $0.018 |
| All-Time High | $0.04876 Nov 26, 2025 |
Monad Labs formed in April 2022. Three former Jump Trading engineers founded the company. Keone Hon serves as CEO and previously led high-frequency trading systems at Jump. James Hansaker acts as CTO and built ultra-low-latency trading infrastructure. Eunice Giarta brings experience from BofA Merrill Lynch and Broadway Technology. The broader team includes over twenty engineers from Jump Crypto and other elite research firms. The group spent more than two years refining the protocol before launch.
The project follows a mission built on three pillars. First, it delivers a smooth developer experience through Ethereum compatibility. Second, it expands into global markets, especially regions with limited banking access. Third, it pursues cutting-edge performance without sacrificing decentralization. The long-term vision centers on powering a global, online-first economy through accessible financial infrastructure.
Monad achieves its speed through several architectural innovations. Parallel execution analyzes transaction dependencies and processes many at once. Superscalar pipelining divides work into stages and runs them simultaneously. Asynchronous input and output prevents data bottlenecks. MonadBFT consensus optimizes HotStuff to deliver fast finality with over 200 validators. MonadDB stores most state data on SSD rather than RAM, which lowers hardware costs and supports decentralization. RaptorCast and a local mempool improve block propagation and bandwidth efficiency.
The project raised roughly $432 million in funding. Investors include Paradigm, Dragonfly Capital, Electric Capital, Greenoaks, Coinbase Ventures, and Galaxy. This capital supports ecosystem growth and long-term research.
Monad Price Prediction: 2026, 2027, 2030-2050
| Year | Minimum Price | Maximum Price | Average Price | Price Change |
| 2026 | $0.016 | $0.0448 | $0.03 | +30% |
| 2027 | $0.0184 | $0.0546 | $0.035 | +50% |
| 2030 | $0.03 | $0.09 | $0.06 | +160% |
| 2040 | $0.072 | $0.1234 | $0.1 | +335% |
| 2050 | $0.1 | $0.3366 | $0.2 | +770% |
Monad Price Prediction 2026
DigitalCoinPrice analysts estimate that in 2026, Monad may trade between $0.0239 (+5%) at the lower end and $0.0448 (+95%) at peak valuation. Their outlook assumes gradual ecosystem traction and recovery from earlier volatility.
According to Coincodex, MON is expected to stay in a tighter range. Their models forecast a minimum price of $0.01603 (-30%), with a potential high of $0.02336 (+1%).
LBank presents a more conservative scenario. Their 2026 estimate places Monad around $0.02 (-15%), reflecting a slow accumulation phase rather than a breakout year.
Monad Price Prediction 2027
DigitalCoinPrice expects Monad to extend its climb in 2027, projecting a range between $0.0356 (+55%) and $0.0546 (+135%), supported by rising market confidence.
Coincodex aligns with the bullish direction. Their forecast suggests a floor of $0.01835 (-20%) and a ceiling of $0.06414 (+180%), pointing to accelerating adoption.
LBank remains cautious. Their 2027 model targets roughly $0.03 (+30%), implying gradual structural growth.
Monad Price Prediction 2030
By 2030, DigitalCoinPrice analysts believe MON could trade between $0.0463 (+100%) and $0.0566 (+145%), driven by expanding network activity.
Coincodex sees much stronger momentum. Their projections indicate a minimum of $0.03 (+30%) and a maximum of $0.09(+290%), assuming Monad evolves into a major infrastructure asset.
LBank’s long-term estimate suggests a modest level near $0.03 (+30%), reflecting a conservative adoption curve.
Monad Price Prediction 2040
Coincodex’s ultra-bullish 2040 scenario places Monad is between $0.089 (+285%) and $0.1234 (+435%), reflecting expectations of massive long-term ecosystem expansion.
DigitalCoinPrice offers a much more conservative view. Their 2040 forecast is between $0.0721 (+215%) and $0.0767 (+235%), suggesting gradual growth rather than explosive dominance.
Monad Price Prediction 2050
Looking further ahead, Coincodex estimates that MON could trade between $0.2364 (+930%) and $0.3366 (+1,365%) by 2050 if adoption compounds over decades.
DigitalCoinPrice’s long-term model suggests a smaller but still notable range between $0.1 (+335%) and $0.11 (+380%), reflecting a cautious outlook shaped by market cycles.
MON Price Prediction: What Do Experts Say?
Expert opinion around Monad remains sharply divided after the mainnet launch. Institutional participation created strong visibility, yet analysts disagree on whether that momentum can convert into sustainable price growth. Most projections for 2026 cluster between cautious optimism and structural skepticism. Targets range widely from modest recovery scenarios to aggressive breakout expectations.
Blockchainreporter outlines a constructive base case that places MON between $0.12 and $0.18 in 2026. Their thesis assumes steady developer migration, expanding DeFi activity, and rising transaction volume. In their framework, a 5–6× increase from the $0.025 public sale price represents a realistic outcome for a Layer 1 network that achieves traction during its first operational year. They emphasize adoption rather than speculation as the primary driver.
Bitget’s research desk supports a similar direction. Their team highlights Monad’s technical efficiency and EVM compatibility as long-term advantages. They place medium-term targets around $0.13–$0.15, contingent on institutional participation and ecosystem maturity. Many analysts now treat the $0.1 level as a psychological checkpoint. A sustained break above that threshold would signal a transition from experimental asset to functional infrastructure.
Crypto researcher Alex Becker presents conditional optimism. He argues that Monad’s scalability could enable 2× gains in 2026, but he rejects the idea of automatic dominance. His position reflects a broader expert consensus: technological superiority alone does not guarantee price appreciation. Real adoption, active users, and fee generation determine long-term value. Without those factors, scalability remains theoretical.
The strongest criticism comes from Arthur Hayes, co-founder of BitMEX. He warns that Monad’s tokenomics create structural sell pressure. Hayes describes MON as a high fully diluted valuation asset with limited circulating float. He highlights that over 30% of supply unlocks during 2026, which could flood the market. In his view, artificial scarcity inflated early pricing. He later exited his position and publicly predicted severe downside risk. His stance rejects the narrative of Monad as an Ethereum successor.
Analyst Manya echoes skepticism from a capital efficiency perspective. She questions whether massive venture funding guarantees token success. Her argument centers on execution risk. Large budgets do not automatically create organic demand.
MON USDT Price Technical Analysis
Monad is trading around $0.023 and continues to demonstrate a steady bullish trend. Over the past 30 days, the token has gained approximately 11%. The price is currently slightly above former resistance zones.
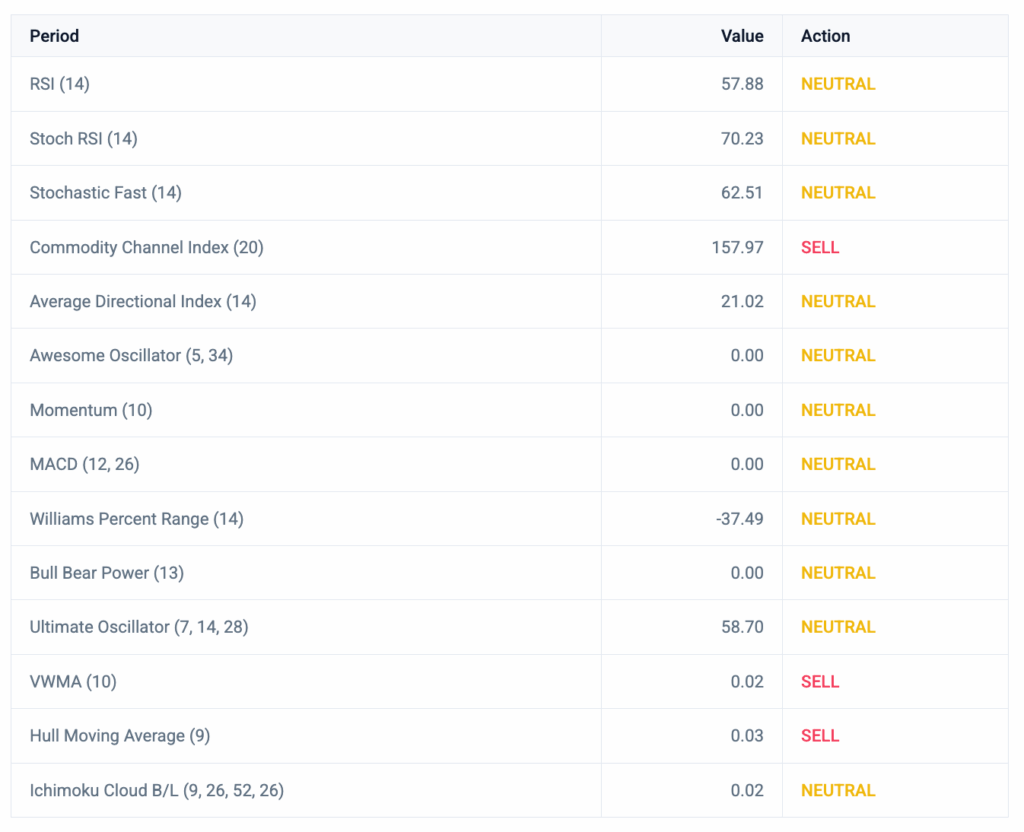
CoinCodex, July 9, 2026
Indicator data confirms the bullish trend. Around 80% of technical signals are neutral.
Volatility remains elevated above 7%, which reflects unstable post-launch conditions. The relative strength index reads near 58. This value sits in neutral territory. The Fear and Greed Index registers extreme fear (22), which historically aligns with fragile sentiment and low conviction buying.
The overall picture for the month indicates gradual stabilization and growth. The price is moving toward historical highs. A sustained hold above $0.025 could form a base. A failure would open up new opportunities for decline. The future structure depends largely on the dynamics of the token supply and the actual activity of the ecosystem.
What Does the MON Price Depend On?
The price of MON does not move randomly. Several structural forces shape its direction. Some factors relate to market psychology. Others come from network mechanics and token supply. Understanding these drivers helps explain why price swings can appear extreme in early-stage blockchains.
The first major factor is token supply dynamics. Monad launched with a large fixed supply and a staged unlock schedule. When new tokens enter circulation, selling pressure increases. Early investors and airdrop recipients often realize profits quickly. That behavior can suppress price even when fundamentals improve. Markets react not only to technology, but to liquidity.
Adoption represents the second pillar. A blockchain gains value when people use it. Transactions, decentralized applications, and active wallets create organic demand. If developers build tools that attract real users, MON benefits from network effects. If activity stagnates, speculative interest fades. Price follows usage over time.
Investor confidence also plays a decisive role. Crypto markets run on narrative as much as metrics. Positive headlines can trigger aggressive rallies. Negative commentary can accelerate selloffs. Large holders influence short-term direction because their orders shift liquidity quickly. Early ecosystems often show exaggerated reactions to news.
Macroeconomic conditions amplify all of these elements. When the broader crypto market enters a bullish phase, capital rotates into emerging Layer 1 projects. In bearish cycles, investors prefer stability and reduce exposure to risk. MON trades inside this wider environment rather than in isolation.
Key drivers include:
- Token unlock schedules and circulating supply expansion.
- Developer adoption and application growth.
- Exchange liquidity and trading volume.
- Institutional participation and venture backing.
- Overall crypto market sentiment.
Technology remains important, but markets price expectations. Fast infrastructure alone does not guarantee appreciation. Sustainable value emerges when performance converts into real economic activity. The MON price ultimately reflects the balance between supply pressure and adoption growth. When demand outpaces emissions, price stabilizes. When supply dominates, volatility returns.
MON Coin Features
Monad positions itself as a performance-first Layer 1 while preserving Ethereum compatibility. Its design focuses on speed, scalability, and decentralization without fragmenting the developer experience. Instead of building a rollup or sidechain, the team redesigned the stack from the ground up. The result combines high throughput with familiar tooling.
At the consensus level, Monad introduces architectural changes that allow fast block production without sacrificing security. The protocol optimizes message flow and validator coordination to reduce bottlenecks.
Key consensus and performance features include:
- MonadBFT consensus, a pipelined Byzantine Fault Tolerant system with linear communication scaling.
- 10,000+ transactions per second throughput.
- 400ms block time for rapid settlement.
- 800ms full finality with speculative confirmation at 400ms.
- Sub-second confirmation suitable for trading and real-time applications.
Execution architecture represents another core innovation. Traditional chains process transactions sequentially. Monad breaks that limitation by running operations in parallel while preserving deterministic results. This model increases efficiency without compromising correctness.
Execution features include:
- Optimistic parallel execution of transactions.
- Asynchronous execution is decoupled from consensus.
- Deferred execution engine that separates ordering from processing.
- Superscalar pipelining across consensus, execution, and storage.
- Just-In-Time compilation for faster smart contract execution.
State management also plays a major role in scalability. Many blockchains demand expensive hardware to operate nodes. Monad reduces this burden through optimized storage design. Lower hardware barriers encourage validator participation and strengthen decentralization.
State and networking capabilities include:
- MonadDB, a custom database optimized for disk and memory efficiency.
- Merkle Patricia Trie architecture for secure state tracking.
- StateSync, which lets new nodes download snapshots instead of replaying full history.
- RaptorCast protocol for fast block propagation.
- linear communication scaling supporting large validator sets.
Developer compatibility remains a defining advantage. Monad maintains full Ethereum Virtual Machine support. Existing smart contracts migrate without modification. This eliminates friction for teams already building on Ethereum.
Developer-focused features include:
- 1:1 EVM bytecode compatibility.
- Support for MetaMask, Foundry, Hardhat, and standard Ethereum tools.
- Cancun fork opcode support including TSTORE and MCOPY.
- Identical opcode-to-gas mapping as Ethereum.
- Geth-compatible RPC interface.
Hardware accessibility reinforces decentralization. Consumer-grade machines can run full nodes effectively. The entire codebase remains open source and built in C++ and Rust, allowing public auditing and community contributions.
Together, these features position Monad as a high-speed infrastructure layer designed for real-world applications rather than experimental scaling. The architecture aims to deliver performance without fragmenting the Ethereum ecosystem.
MON Coin Price Prediction: Questions and Answers
Will Monad Be a Good Investment?
Monad carries both opportunity and risk. The project offers advanced infrastructure and strong funding, which supports long-term development. However, the token still trades in a highly speculative environment. Price depends on adoption, unlock schedules, and overall market cycles. Investors should treat MON as a high-volatility asset. Potential upside exists, but downside risk remains significant in early ecosystem stages.
How Much Is 1 Monad (MON)?
At the time of writing, 1 MON trades around $0.023. The price fluctuates within a narrow consolidation range after the post-launch correction. Short-term movements remain sensitive to liquidity and sentiment. Traders should expect rapid swings even during sideways periods. Real-time exchange data always provides the most accurate valuation.
What Is the Total Supply of Monad?
Monad has a fixed total supply of 100 billion MON. No additional tokens can be minted beyond that amount. Circulating supply expands gradually through unlock schedules. This structure means emission timing matters more than inflation. Supply pressure enters the market in phases rather than continuously.
How High Will Monad Crypto Go?
No model can predict an exact ceiling. Bullish projections assume strong developer adoption and network usage. Conservative scenarios expect slower ecosystem growth. Long-term targets vary widely among analysts. Some forecasts remain modest, while others assume exponential expansion. Price ultimately follows real demand, not theoretical capability.
Will Monad Reach $0.1?
A move to $0.1 requires roughly a 5× increase from current levels. Analysts view this as possible if adoption accelerates and liquidity improves. That level also represents a psychological milestone. Breaking it would signal structural recovery. However, it depends on sustained buying pressure and ecosystem traction.
Will Monad Reach $1?
A $1 valuation implies a massive market cap expansion. This scenario demands global adoption and sustained capital inflow. It cannot occur through speculation alone. Infrastructure success and real application usage would need to justify the valuation. Most analysts treat $1 as a long-term possibility rather than a near-term expectation.
Will Monad Reach $10?
A $10 target represents extreme optimism. It would require exponential ecosystem dominance and multi-cycle growth. Only a handful of Layer 1 assets achieved comparable scaling. Analysts consider this outcome highly speculative. It remains a theoretical ceiling rather than a practical forecast.
What Is the Price Prediction for Monad in 2026?
Forecasts for 2026 range from conservative stabilization to moderate recovery. Some analysts expect prices near $0.02–$0.03. Others project stronger rebounds above $0.04 under bullish conditions. Most scenarios assume gradual rebuilding after early volatility. Adoption metrics will determine which path unfolds.
What Is the Monad Price Prediction for 2030?
Long-term projections diverge sharply. Conservative models expect incremental growth. Aggressive forecasts assume Monad becomes major infrastructure. These scenarios produce wide price ranges. Analysts agree that 2030 valuation depends almost entirely on developer ecosystem strength and user activity.
Why Is Monad Crashing?
Price declines follow supply pressure and early profit taking. Airdrop distribution and unlock schedules increase circulating tokens. Markets often overreact during launch phases. Weak sentiment amplifies selling. The crash reflects liquidity dynamics rather than technical failure. Network fundamentals can improve while price still falls.
Is Monad on Ethereum?
Monad is not built on Ethereum, but it is fully compatible with Ethereum. It operates as an independent Layer 1 blockchain with its own consensus and infrastructure. However, developers can deploy Ethereum smart contracts without modification. This compatibility allows Monad to inherit Ethereum’s tooling and ecosystem while maintaining its own performance architecture.
Is Monad Better than Solana?
Monad and Solana pursue similar performance goals but use different designs. Monad emphasizes EVM compatibility and lower hardware requirements. Solana prioritizes raw throughput with a distinct execution model. “Better” depends on developer needs and adoption. Performance alone does not determine success. Ecosystem growth, stability, and real usage decide long-term leadership.
Where to Buy Monad Coin?
StealthEX is here to help you buy Monad if you’re looking for a way to invest in this cryptocurrency. You can buy MON safely and without the need to sign up for the service. StealthEX crypto collection has more than 2,000 different coins and you can do wallet-to-wallet transfers instantly and problem-free.
How to Buy Monad? Quick-Step Guide
Just go to StealthEX and follow these easy steps:
- Choose the pair and the amount you want to exchange — for instance, ETH to MON.
- Press the “Start exchange” button.
- Provide the recipient address to transfer your crypto to.
- Process the transaction.
- Receive your crypto coins.
Follow us on Medium, X, Telegram, YouTube, and Publish0x to stay updated about the latest news on StealthEX and the rest of the crypto world.
Don’t forget to do your own research before buying any crypto. The views and opinions expressed in this article are solely those of the author.
crypto price prediction MON Monad price analysis price predictionThe post Monad Price Prediction: Will MON Coin Reach $1 Soon? first appeared on StealthEX.]]>
At the time of writing, Beldex (BDX) is trading at approximately $0.088, which is also near its highest level in the past month. Previously, on June 12, the token experienced a sharp but brief decline when its price briefly dropped to approximately $0.012 before quickly recovering. Except for this sudden correction, BDX has shown relatively stable growth between $0.008 and $0.009 over the past month.
In this guide, you will discover the latest BDX price predictions, historical price performance, technical analysis, and long-term forecasts extending through 2026, 2027, 2030, and beyond. You will also learn which factors influence the value of Beldex, what experts expect from the project, and how beginners can interpret price projections without needing advanced trading knowledge. So, let’s get started!
| Current BDX Price | BDX Price Prediction 2026 | BDX Price Prediction 2030 |
| $0.088 | $0.13 | $0.21 |
Beldex (BDX) Overview
Beldex (BDX) is a privacy-focused cryptocurrency that aims to give users greater control over their digital transactions and online activity. Unlike many traditional blockchain networks, Beldex places a strong emphasis on anonymity, data protection, and censorship resistance. The project has evolved from a simple privacy coin into a broader ecosystem that includes products such as BChat, BelNet, Beldex Browser, and cross-chain privacy solutions.
The Beldex network uses a decentralized architecture that helps conceal transaction details while maintaining security and transparency at the blockchain level. As concerns about digital privacy continue to grow worldwide, Beldex has positioned itself as a project that focuses on protecting user information without sacrificing usability.
From an investment perspective, BDX has gradually transformed from a niche privacy token into a mid-sized cryptocurrency with a market capitalization above $600 million. Despite experiencing periods of volatility, the coin has shown resilience during difficult market conditions and continues to attract investors interested in privacy-focused blockchain technology. As a result, many long-term Beldex price predictions remain closely tied to the adoption of privacy applications and the overall growth of the Beldex ecosystem.
BDX Price Statistics
| Metric | Value |
| Current Price | $0.088 |
| Market Cap | $693,745,619 |
| Volume (24h) | $19,524,197 |
| Market Rank | #210 |
| Circulating Supply | 7,869,277,276 BDX |
| Total Supply | 9,938,217,276 BDX |
| 1 Month High / Low | $0.09279 / $0.01236 |
| All-Time High | $0.1716 |
| All-Time Low | $0.01236 |
BDX Price Chart
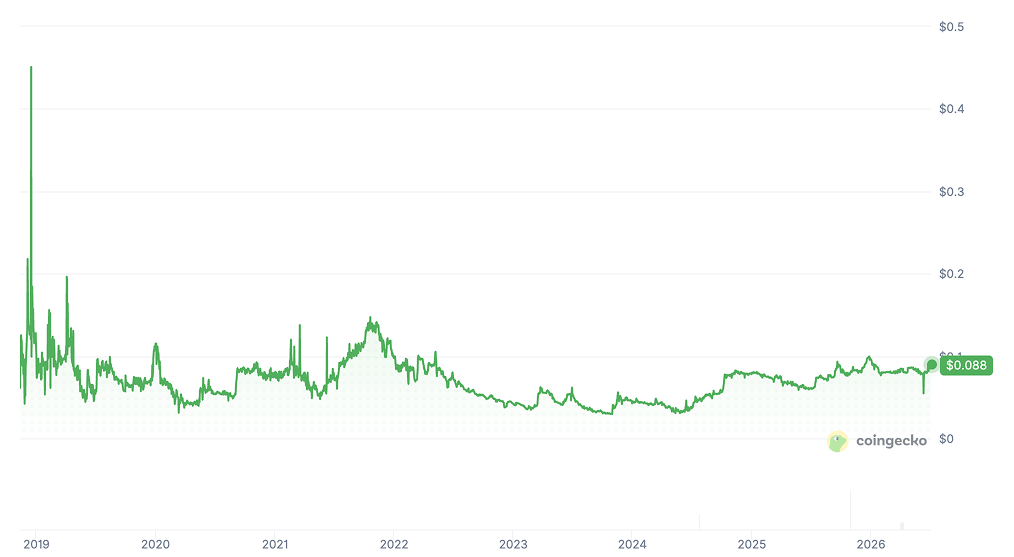
CoinGecko, July 3, 2026
Beldex (BDX) Price History Highlights
2019 – The First Steps on the Market
After reaching its historical peak during its earliest trading period in 2018, Beldex spent much of 2019 stabilizing and building its ecosystem. The project shifted its focus toward becoming a privacy-first blockchain rather than simply another cryptocurrency. Trading activity remained relatively modest, while developers concentrated on long-term infrastructure and community growth instead of short-term price performance.
2020 – Consolidation and a Slow Rise
Throughout 2020, BDX traded within a relatively narrow range as the project continued expanding its technology. While Bitcoin and other major cryptocurrencies recovered strongly after the pandemic-related crash, Beldex followed a slower and more sustainable path. Investors gradually became more interested in privacy-focused projects, helping the token establish stronger long-term support levels.
2021 – A Bull Market and a Major Upgrade
The cryptocurrency bull market of 2021 brought renewed attention to Beldex. Although the token did not surpass its historical all-time high from 2018, it benefited from improving market sentiment and ongoing ecosystem expansion. The launch of additional privacy products and network upgrades strengthened investor confidence, allowing BDX to outperform many smaller blockchain projects during the broader market rally.
2022 – Crypto Bear Market Pressure
The collapse of the global crypto market in 2022 affected Beldex just as it did most digital assets. Higher interest rates, declining liquidity, and several industry bankruptcies reduced investor appetite for risk. Despite the difficult environment, the Beldex team continued developing its ecosystem, helping the project retain a loyal community while many competing projects disappeared from the market.
2023 – Market Bottom and Slow Recovery
In 2023, BDX entered a prolonged consolidation phase as volatility declined across the cryptocurrency market. Instead of speculative rallies, the project focused on product development, including BChat, BelNet, and other privacy-oriented services. This steady progress helped strengthen the project’s fundamentals while investors waited for the next major market cycle.
2024 – Renewed Attention and Stronger Momentum
As the crypto market recovered during 2024, Beldex gradually regained momentum. Growing interest in decentralized privacy solutions and blockchain applications supported higher trading activity, while the ecosystem continued expanding. Although BDX remained well below its historical record, the token established a stronger long-term trend and attracted new investors looking beyond mainstream cryptocurrencies.
2025 – Growth, Pullbacks, and Market Maturity
During 2025, Beldex traded with noticeably lower volatility than many comparable altcoins. The token experienced several healthy corrections, but buyers consistently defended key support levels. Continued ecosystem development and increasing adoption helped BDX mature into a more stable digital asset, with a market capitalization comfortably above half a billion dollars for much of the year.
2026 – New Achievements and New Heights
In 2026, Beldex continued to rank among the leading privacy-focused cryptocurrencies. The token traded around $0.08, supported by a market capitalization exceeding $600 million and a circulating supply of roughly 7.7 billion BDX. During the sharp market correction on June 12, the price briefly dropped to around $0.012 before recovering to monthly highs near $0.09, demonstrating strong buying interest despite short-term volatility.
Short-Term Beldex Price Targets
Beldex (BDX) Price Prediction Today
According to CoinCodex, Beldex is expected to trade around $0.088 today, with virtually no change from current levels. The platform’s algorithm suggests that the market remains in a consolidation phase after the recent volatility, indicating balanced buying and selling pressure. Meanwhile, DigitalCoinPrice projects an average June price of $0.09, supporting the view that BDX is likely to remain stable in the immediate term.
Beldex (BDX) Price Prediction Tomorrow
Short-term forecasts point to another relatively quiet trading session. CoinCodex predicts BDX will remain near $0.089, while MEXC‘s forecasting model estimates a similar price around $0.088 for the following day. Both projections suggest that no major breakout is expected unless Bitcoin or the broader cryptocurrency market experiences a sudden shift in momentum.
Beldex (BDX) Price Prediction This Week
The weekly outlook remains cautiously optimistic. CoinCodex expects BDX to trade between $0.088 and $0.089, representing a potential gain of roughly 1.5% by the end of the week. Technical analysis published by CoinDCX also points to a stabilization phase, with support around $0.09 and resistance near $0.094, suggesting that moderate upside remains possible if market sentiment improves.
Beldex (BDX) Price Prediction Next Month
Forecasts become considerably more diverse when looking one month ahead. DigitalCoinPrice expects BDX to trade between $0.088 and $0.09 during July 2026, indicating another month of sideways movement. In contrast, PricePrediction.net forecasts a much wider range between $0.079 and $0.097, while CoinCodex’s algorithm projects a stronger rally toward $0.12, representing an increase of more than 30% from current prices.
Beldex Price Prediction: 2026, 2027, 2030-2050
| Year | Minimum Price | Maximum Price | Average Price | Price Change |
| 2026 | $0.088 | $0.18 | $0.13 | +45% |
| 2027 | $0.1 | $0.22 | $0.16 | +80% |
| 2030 | $0.13 | $0.39 | $0.21 | +140% |
| 2040 | $0.19 | $0.2 | $0.2 | +130% |
Beldex (BDX) Coin Price Prediction 2026
DigitalCoinPrice estimate that in 2026, Beldex could trade between $0.088 (0%) at the lower end and $0.0988 (+19%) at its yearly peak. Their forecast suggests a relatively stable year, with temporary weakness during autumn followed by a modest recovery toward the end of the year.
According to PricePrediction, BDX may experience significantly stronger upside in 2026. Its projections place the token between $0.0925 (+5%) and $0.18 (+105%), reflecting expectations of improving market sentiment and increased adoption throughout the second half of the year.
BDX Crypto Price Prediction 2027
DigitalCoinPrice expects Beldex to continue its gradual appreciation in 2027, forecasting a price range between $0.1 (+15%) and $0.12 (+35%). The model suggests steady ecosystem growth and continued accumulation could support higher valuations.
PricePrediction presents a more optimistic, yet volatile, outlook. Its forecasts indicate BDX could trade between $0.12 (+35%) and $0.22 (+150%), implying substantial upside potential despite expected market fluctuations during the year.
BDX Token Price Prediction 2030
By 2030, DigitalCoinPrice believes Beldex may trade between $0.13 (+50%) and $0.17 (+95%), reflecting gradual long-term expansion and continued development of the project’s privacy-focused ecosystem.
PricePrediction projects a significantly higher valuation by 2030. Its estimates range from $0.27 (+200%) to $0.39 (+350%), assuming broader blockchain adoption, stronger investor demand, and sustained growth across the cryptocurrency market.
Beldex Price Prediction 2040
DigitalCoinPrice forecasts Beldex to reach between $0.19 (+115%) and $0.2 (+125%) by 2040. These projections suggest long-term appreciation driven by increasing network maturity and wider adoption of decentralized privacy solutions.
BDX Coin Price Prediction 2050
Looking further ahead, DigitalCoinPrice estimates that Beldex could trade between $0.19 (+115%) and $0.2 (+125%) by 2050. Such projections assume decades of ecosystem development, continued blockchain adoption, and favorable long-term market conditions.
Beldex (BDX) Price Prediction: What Do Experts Say?
Most experts agree that Beldex’s future depends less on short-term speculation and more on the real-world adoption of its privacy ecosystem. CoinMarketCap‘s AI analysis highlights products such as the Beldex Name Service (BNS), merchant integrations, and privacy applications as key drivers that could increase demand for BDX over time. At the same time, the report warns that regulatory scrutiny surrounding privacy coins and competition from projects like Monero and Zcash remain significant risks.
Other forecasting platforms take a more conservative approach. CoinLore, Traders Union, and WEEX expect gradual growth, with BDX remaining close to its current valuation while benefiting from steady ecosystem expansion. In contrast, Gate.com publishes a much more aggressive forecast, projecting multi-fold gains by 2026. Given the large gap between these models, investors should treat extremely bullish targets with caution and focus on fundamentals, adoption, and overall cryptocurrency market conditions rather than optimistic price estimates alone.
BDX USDT Price Technical Analysis
According to the latest Investing.com technical analysis, the outlook for BDX/USDT remains highly positive. The platform currently assigns the pair an overall “Strong Buy” rating, with all 12 major moving averages generating Buy signals. Technical indicators are also supportive, although a few suggest that short-term volatility should still be expected.
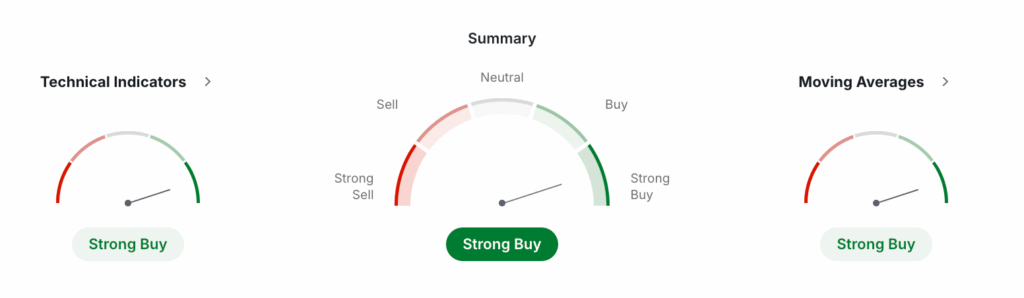
Investing, July 3, 2026
Overall, the chart indicates that buyers remain in control and that the broader trend continues to favor higher prices unless key support levels are broken.
BDX 50-Day SMA, 200-Day SMA and RSI
Three indicators stand out when evaluating the current trend:
- 50-Day SMA: $0.051 (Buy)
- 200-Day SMA: $0.013 (Buy)
- RSI (14): 62 (Buy)
The fact that BDX trades well above both the 50-day and 200-day Simple Moving Averages confirms a strong long-term uptrend. At the same time, the Relative Strength Index (RSI) remains below the overbought threshold of 70, suggesting that the rally may still have room to continue before buyers become exhausted.
BDX Key Price Levels
Support and resistance levels help traders identify potential reversal points where buying or selling activity could increase. Based on the latest Classic Pivot Points from Investing.com, BDX is currently trading near its central pivot at $0.079, placing it in a key decision zone.
Support Levels
The nearest support levels are:
- S1: $0.049
- S2: $0.015
- S3: $-0.008
As long as BDX stays above $0.072, the short-term trend remains constructive. If sellers push the price below $0.07, bearish momentum could strengthen and lead to a larger correction.
Resistance Levels
The closest resistance zones are located at:
- R1: $0.107
- R2: $0.129
- R3: $0.164
A breakout above $0.1 would likely strengthen bullish sentiment and could signal the beginning of another upward move. Higher trading volume near these levels would provide additional confirmation of a successful breakout.
Simple Moving Average (SMA)
The Simple Moving Average (SMA) analysis is one of the strongest bullish signals currently available for BDX.
Since the current market price remains above every major SMA, the long-term trend continues to favor buyers.
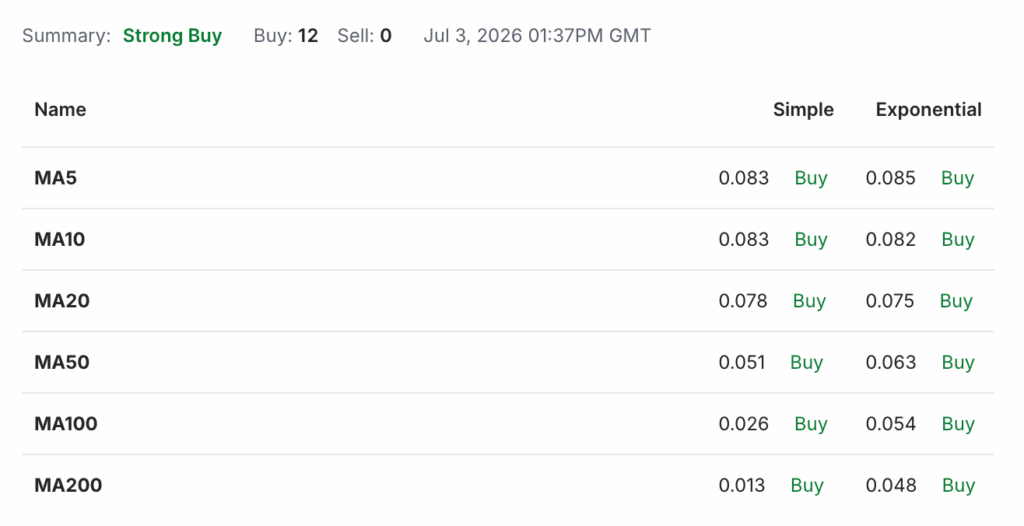
Investing, July 3, 2026
Exponential Moving Average (EMA)
The Exponential Moving Average (EMA) indicators also point toward continued strength.
Unlike SMAs, EMAs respond more quickly to recent price changes. The fact that every major EMA generates a Buy signal suggests that bullish momentum remains intact across both short-term and long-term timeframes.
BDX Oscillators
Oscillators provide additional insight into market momentum. While not all indicators agree, the overall picture remains positive.
Main bullish indicators:
- RSI (14): 62.001
- STOCH(9,6): 66.38
- MACD(12,26): 0.01
- Williams %R: -23.767
- Ultimate Oscillator: 58.856
- Rate of Change (ROC): 39.783
Bearish indicators:
- Stochastic RSI: 53.351 Neutral
- ADX: 35.826 Sell
In total, Investing.com reports 9 Buy signals, 1 Neutral signal, and 1 Sell signals, resulting in an overall Strong Buy technical rating. While some momentum indicators suggest caution after the recent rally, the broader technical structure continues to support a positive outlook for Beldex.
What Does the Beldex Price Depend On?
The price of Beldex changes constantly because it reacts to several market and project-specific factors. The most important drivers include:
- Overall crypto market sentiment – BDX often follows the direction of Bitcoin and the broader altcoin market.
- Ecosystem adoption – Greater use of products like BChat, BelNet, and Beldex Name Service (BNS) can increase demand for BDX.
- Supply and demand – More buyers than sellers generally push the price higher.
- Exchange listings and liquidity – New listings and higher trading volume can improve accessibility and attract investors.
- Regulatory developments – Privacy coins face additional regulatory risks that may affect investor confidence.
- Network upgrades and partnerships – New features, integrations, and technological improvements can strengthen long-term growth prospects and support higher valuations.
Beldex (BDX) Features
Beldex is more than just a privacy coin. The project is building a complete privacy-focused Web3 ecosystem designed to protect transactions, communication, browsing, and digital identity. Its main features include:
- Private transactions using technologies such as Ring Signatures, RingCT, and Stealth Addresses to hide sender, receiver, and transaction amounts.
- BChat, a decentralized messaging application that does not require a phone number or email registration.
- BelNet, a decentralized VPN that helps users browse the internet anonymously.
- Beldex Browser, designed to improve online privacy and resist tracking.
- Beldex Name Service (BNS), which replaces long wallet addresses with human-readable names.
- Proof-of-Stake and Masternodes, allowing users to stake BDX and help secure the network while supporting ecosystem services.
Correlation
Like most altcoins, Beldex is influenced by overall cryptocurrency market sentiment. Its price often follows Bitcoin and the broader market, although project-specific news can sometimes cause independent price movements.
Positively Correlated Cryptocurrencies
BDX is generally positively correlated with Bitcoin (BTC) and Ethereum (ETH) because they drive the overall crypto market. It also tends to move in the same direction as privacy-focused coins like Monero (XMR) and Zcash (ZEC).
Negatively Correlated Cryptocurrencies
Beldex does not have a strong long-term negative correlation with any major cryptocurrency. However, it can temporarily outperform or underperform the market when privacy coins attract more attention or when ecosystem developments create independent buying pressure.
How Beldex (BDX) Price Projection Works
Beldex price projections are created by combining technical analysis, historical price data, market trends, and fundamental factors. Analysts evaluate indicators such as moving averages, RSI, and trading volume while also considering ecosystem growth, adoption, and overall cryptocurrency sentiment.
Since crypto markets are highly volatile, forecasts should be viewed as possible scenarios rather than guarantees. Long-term price predictions become more reliable when supported by continued development and increasing real-world use of the Beldex ecosystem.
Bledex Price Prediction: Questions and Answers
Is BDX Coin a Good Investment?
BDX may appeal to investors seeking exposure to privacy-focused blockchain projects. However, like all cryptocurrencies, it remains a high-risk asset and should be evaluated alongside your risk tolerance.
Is Beldex Coin Safe?
Beldex uses privacy technologies and a Proof-of-Stake network to secure transactions. While the blockchain is secure, investing in BDX still carries market and regulatory risks.
What Is the Current Beldex Value?
At the time of writing, Beldex trades at approximately $0.088. The price changes continuously depending on market conditions and trading activity.
What Is the All-Time High of Beldex?
According to CoinGecko, Beldex reached its all-time high of approximately $0.4508 in 2018 during its early trading history.
What Is Beldex’s Price Prediction Today?
Most short-term models expect BDX to trade around $0.088-$0.09 today, with limited volatility unless the broader crypto market changes direction.
What Is Beldex’s Price Prediction for Tomorrow?
Current forecasts suggest another stable session, with BDX likely fluctuating close to $0.088-$0.09 if market conditions remain unchanged.
What Is the Beldex Price Prediction for This Week?
Technical models indicate BDX could remain between $0.086 and $0.092 this week as the market continues to consolidate.
What Is the Beldex Price Prediction for Next Week?
If bullish momentum continues, BDX may test nearby resistance levels around $0.09, although sideways trading remains the base scenario.
What Will the Price of Beldex Be Next Month?
DigitalCoinPrice forecasts July 2026 between $0.088 and $0.089, while PricePrediction estimates a wider range of $0.079-$0.097.
Will Beldex Go Up?
Beldex could appreciate if adoption of its privacy ecosystem grows and the overall cryptocurrency market remains bullish, but no outcome is guaranteed.
How High Can Beldex Go?
Long-term forecasts vary significantly. Conservative models target around $0.14 by 2030, while more bullish estimates exceed $0.57.
Will BDX Price Hit $0.2?
Yes, reaching $0.2 appears achievable under optimistic scenarios. PricePrediction expects BDX to exceed this level before 2030.
Will Beldex Coin Reach $1?
Reaching $1 would require substantial ecosystem growth and a much larger market capitalization. Current long-term forecasts do not project this level.
Will BDX Reach $10?
A price of $10 is extremely unlikely under current supply conditions and would require a market capitalization far beyond today’s largest cryptocurrencies.
Will Beldex Price Hit $50?
Based on the current circulating supply, $50 per BDX is not considered a realistic long-term target by mainstream forecasting models.
Will BDX Reach $100?
A price of $100 would imply an enormous valuation that is unrealistic under the current tokenomics and available long-term projections.
How Much Is BDX Worth in 2026?
DigitalCoinPrice forecasts $0.088-$0.098, while PricePrediction expects $0.09-$0.18, depending on market conditions.
What Is the Beldex Price Prediction for June 2026?
DigitalCoinPrice projects BDX to trade around $0.089, indicating a relatively stable month with limited volatility.
What Is the Approximate Beldex Price Prediction for Q3 2026?
For Q3 2026, forecasts range from $0.078 to $0.167, depending on the source and assumptions regarding market recovery.
How Much Is BDX Worth in 2027?
DigitalCoinPrice estimates $0.1-$0.12, while PricePrediction forecasts a broader range between $0.012 and $0.22.
How Much Is Beldex Worth in 2030?
Forecasts for 2030 range from $0.11-$0.14 according to DigitalCoinPrice and $0.27-$0.39 according to PricePrediction.
How Much Is Beldex Worth in 2040?
DigitalCoinPrice forecasts BDX between $0.19 and $0.2 by 2040 under a scenario of continued ecosystem expansion.
What Is the Long-Term Forecast for Beldex (2040, 2050 and beyond)?
DigitalCoinPrice estimates BDX could reach $0.19 by 2040 and $0.2 by 2050, assuming favorable long-term adoption trends.
What Role Does Market Sentiment Play in Beldex Price Predictions?
Market sentiment is one of the biggest drivers of BDX. Bullish crypto cycles can boost demand, while fear and uncertainty often lead to lower prices regardless of fundamentals.
Where to Buy BDX Coin
You can buy Beldex (BDX) on several cryptocurrency exchanges, including Kraken, KuCoin, and MEXC. If you prefer a wallet-to-wallet exchange without registration, StealthEX allows you to swap more than 2,000 cryptocurrencies directly into BDX while keeping full control of your funds.
How to Buy Beldex? Quick-Step Guide
Just follow these steps:
- Choose the crypto pair and enter the amount (for example, ETH to BDX).
- Click the “Start Exchange” button.
- Enter your Beldex wallet address.
- Send the funds to the provided deposit address.
- Receive BDX directly in your wallet.
That’s it. The entire process takes only a few minutes and does not require registration.
Follow us on Medium, X, Telegram, YouTube, and Publish0x to stay updated about the latest news on StealthEX.io and the rest of the crypto world.
Don’t forget to do your own research before buying any crypto. The views and opinions expressed in this article are solely those of the author.
BDX Beldex crypto price prediction cryptocurrency price predictionThe post Beldex (BDX) Price Prediction 2026, 2027-2030 first appeared on StealthEX.]]>

CoinGecko, July 1, 2026
At the moment, SUI trades around $0.7, which reflects a period of short-term stabilization after recent volatility. Over the past month, the price dropped to a low of $0.655 on June 24, but earlier, it reached a local high of $0.878 on June 1. This range shows that the market is actively testing both support and resistance levels, which often signals that a larger move may be building in the background.
In this guide, you will learn how to approach SUI price prediction step by step, without unnecessary complexity. We will start with short-term targets, then move into long-term forecasts from 2026 to 2050, based on available data and market behavior. After that, we will explain key technical indicators, price levels, and correlations in a way that is easy to follow, even if you are new to crypto.
By the end, you will not only understand where SUI could go, but also how to analyze its price on your own and make more informed decisions.
| Current SUI Price | SUI Price Prediction 2026 | SUI Price Prediction 2030 |
| $0.7 | $1.5 | $3 |
Short-Term Sui Price Targets
Let’s break down realistic short-term SUI price prediction scenarios using fresh 2026 data from DigitalCoinPrice and PricePrediction. These forecasts help you understand what may happen over the next few months.
For the near term, July 2026 projections stay close to the current price of $0.93. DigitalCoinPrice expects SUI to move between $0.66 and $0.69, with an average near $0.67. This suggests a period of consolidation rather than strong growth. However, PricePrediction.net presents a wider range. Their April forecast starts at $0.65 and reaches up to $2.49, with an average of around $1.27. In simple terms, short-term expectations remain cautious, but upside potential already appears if momentum increases.
Looking ahead to August and September 2026, forecasts begin to diverge more clearly. DigitalCoinPrice sees gradual growth, with SUI reaching around $0.76 in August and up to $0.87 in September. This reflects a steady trend rather than explosive movement. In contrast, PricePrediction.net expects a much stronger rally. Their August projection ranges from $2.11 to $2.52. This scenario assumes strong demand and a favorable market environment.
Toward the end of 2026, both sources remain optimistic, but at different levels. DigitalCoinPrice expects SUI to stay near $0.72-$0.85 in November and December. Meanwhile, PricePrediction.net forecasts much higher levels, with December estimates reaching up to $2.19.

Long-Term Sui Prediction (2026–2050)
| Year | Minimum Price | Maximum Price | Average Price | Price Change |
| 2026 | $0.66 | $2.52 | $1.5 | +115% |
| 2027 | $0.72 | $3.07 | $2 | +185% |
| 2030 | $0.86 | $5.61 | $3 | +330% |
| 2040 | $1.86 | $17.14 | $10 | +1,330% |
Sui Price Prediction 2026
According to DigitalCoinPrice, Sui (SUI) could trade between $0.66 (-5%) at the lower end and $0.9 (+30%) at its peak in 2026. These projections suggest moderate growth, with price fluctuations driven by market cycles and gradual ecosystem expansion.
PricePrediction offers a more bullish outlook. Their model estimates a minimum price of $2.11 (+200%), an average of $2.19, and a potential high of $2.52 (+260%), indicating strong upside potential if adoption accelerates.
Telegaon presents an extremely optimistic scenario. Their 2026 forecast places SUI between $1.08 (+55%) and $2.11 (+200%), assuming rapid network growth and significant capital inflows into the ecosystem.
Sui Price Prediction 2027
DigitalCoinPrice expects continued upward momentum in 2027. Their forecasts show SUI ranging from $0.72 (+5%) to $1.12 (+60%), supported by improving sentiment and expanding use cases.
PricePrediction, however, takes a more cautious stance. Their projections suggest a minimum of $0.89 (+25%) and a maximum of $1.15 (+65%), pointing to a potential consolidation phase after earlier gains.
Telegaon remains strongly bullish. Their 2027 outlook forecasts SUI between $2.14 (+205%) and $3.07(+340%), reflecting confidence in long-term adoption and ecosystem maturity.
Sui Price Prediction 2030
By 2030, DigitalCoinPrice analysts believe SUI could stabilize at higher levels, with prices ranging from $0.86 (+25%) to $1.28 (+85%), depending on broader market conditions.
PricePrediction sees stronger long-term growth. Their estimates place SUI between $2.42 (+245%) and $3.24 (+365%), assuming continued development and real-world utility expansion.
Telegaon delivers a significantly more aggressive forecast. According to their model, SUI could reach between $4.75 (+580%) and $5.61 (+700%), driven by mass adoption and strong demand across DeFi and Web3 sectors.
Sui Price Prediction 2040
Looking further ahead, DigitalCoinPrice projects SUI between $1.86 (+165%) and $1.92 (+175%), suggesting steady long-term growth rather than explosive expansion.
Telegaon, however, anticipates a much higher valuation. Their 2040 forecast places SUI between $16.56 (+2,250%) and $17.14 (+2,350%), reflecting expectations of large-scale global adoption.
Sui Price Prediction 2050
In a long-term scenario, DigitalCoinPrice estimates that SUI could reach between $4.63 (+560%) and $4.81 (+585%) by 2050, assuming the network maintains relevance over decades.
SUI Technical Analysis
According to monthly data from Investing (July 2026), the overall technical outlook for Sui shows Strong Sell signals.

Investing, July 1, 2026
The summary clearly confirms bearish pressure. Technical Indicators show 7 sell signals and 0 buy signals. Moving Averages show 10 sell signals and only 2 buy signals. This alignment suggests that sellers currently dominate the market.
RSI (14) stands at 38.895 and signals Sell. This level shows weak momentum, but it does not indicate extreme panic yet. MACD (12,26) prints -0.21 and also signals Sell, which confirms ongoing downward pressure. ADX (14) at 30.128 shows a strong trend, and it supports the bearish direction.
At the same time, several oscillators show oversold conditions. Stochastic (9,6) sits at 5.196. StochRSI (14) reads 0.69. Williams %R stands at -98.7. These values suggest that SUI trades near short-term exhaustion. However, oversold conditions alone do not guarantee a reversal.
Other indicators also confirm weakness. CCI (14) at -90.0484 signals Sell. ROC shows -78.362, which reflects strong negative momentum. Bull/Bear Power at -1.3711 also supports bearish control.
Overall, the current structure remains weak. Until indicators shift toward Neutral or Buy, short-term SUI price prediction scenarios stay cautious.
SUI Key Price Levels
Pivot points help define important support and resistance zones. The main Classic Pivot stands at 0.7488, which acts as a key balance level.
If SUI trades below this level, bearish pressure may continue.
Key support levels are:
- S1: 0.5948
- S2: 0.4991
- S3: 0.3451
If the price breaks below 0.6 sellers may push the market toward deeper zones near 0.5 or even 0.4.
Key resistance levels are:
- R1: 0.8445
- R2: 0.9985
- R3: 1.0942
A breakout above 0.9 could open the path toward 1. Strong momentum could extend the move toward 1.1.
Popular Sui Moving Averages and Oscillators
Moving averages clearly reflect the current downtrend.

Investing, July 1, 2026
Short-term averages show strong weakness:
- MA5: 0.8151 (Sell)
- MA10: 1.1398 (Sell)
- MA20: 2.2179 (Sell)
Medium-term averages also signal Sell:
- MA50: 1.3253 (Sell)
- MA100 (EMA): 1.392 (Sell)
Only long-term averages show some support:
- MA100 (Simple): 0.6626 (Buy)
- MA200 (Simple): 0.3313(Buy)
This structure suggests that short- and mid-term pressure remains strong, while long-term support still exists below the current price.
Oscillators confirm the bearish setup:
- CCI (14): -90.0484 (Sell)
- ROC: -78.362 (Sell)
- Bull/Bear Power: -1.3711 (Sell)
- Ultimate Oscillator: 25.127 (Oversold)
ATR (14) at 0.8655 indicates relatively lower volatility compared to strong breakout phases. This suggests that the market may be preparing for a larger move, but direction remains uncertain.
Correlation
SUI shows a strong correlation with major cryptocurrencies, especially Bitcoin and Ethereum. When Bitcoin rises, SUI often follows due to increased market confidence and liquidity. However, during bearish phases, SUI tends to drop faster because it is a smaller and more volatile asset.
SUI also reacts to trends in the broader altcoin market. When capital flows into altcoins, SUI usually benefits. On the other hand, risk-off sentiment pushes investors back into Bitcoin, which weakens SUI performance.
Overall, SUI remains highly dependent on global crypto market direction and investor sentiment.
Sui Price Prediction: Questions and Answers
What Is SUI’s Price Prediction Today?
SUI price today depends mainly on short-term momentum and market sentiment. Based on current structure, the price may stay near the $0.65-$0.75 range. Technical indicators show weakness, so upside remains limited for now. However, if volume increases and Bitcoin strengthens, SUI could attempt a move toward resistance near $1.
What Is the SUI Price Prediction for This Week?
For this week, SUI may continue to trade sideways with slight bearish pressure. The most likely range stays between $0.69 and $0.72. Weak indicators suggest limited upside. However, a sudden shift in market sentiment could push the price higher, especially if Bitcoin breaks resistance.
What Is the SUI Price Prediction for Next Week?
Next week, SUI could either stabilize or attempt a recovery. If support holds near $0.7, price may move toward $1 again. However, if sellers stay active, SUI could test lower levels near $0.6. Direction depends heavily on overall crypto market strength.
What Will the Price of SUI Be Next Month?
Next month, forecasts suggest a range between $0.66 and $0.8 based on available data. Conservative models expect consolidation, while more bullish scenarios point to a breakout above $0.9. The final outcome will depend on volume, adoption growth, and broader market trends.
What Is the SUI Price Prediction for 2026?
SUI price prediction for 2026 varies widely. Conservative estimates place SUI between $0.7 and $1, suggesting moderate growth. More bullish models expect prices between $2 and $2.5. Extremely optimistic scenarios even go above $2.5, but these depend on rapid adoption and strong market expansion.
What Is the SUI Price Prediction for 2027?
In 2027, SUI could either continue growing or enter consolidation. Estimates range from $0.7 to $3, depending on market conditions. Some models expect slower growth after 2026, while others predict strong expansion if the ecosystem continues to develop.
What Is the SUI Price Prediction for 2030?
By 2030, SUI may reach higher levels if adoption increases. Conservative forecasts suggest $1 to $2, while more optimistic models expect $4 to $5. Aggressive predictions go much higher, but they rely on mass adoption and strong demand across Web3.
What Is the SUI Price Prediction for 2040?
Long-term projections for 2040 show strong divergence. Some estimates place SUI around $4, which reflects steady growth. More aggressive models predict prices above $100, assuming global adoption and major ecosystem expansion. Long-term outcomes remain uncertain and depend on real-world usage.
Can SUI Reach $3?
SUI can reach $3 if adoption increases and the market enters a strong bullish cycle. Some forecasts already place SUI above this level by 2030. However, reaching $3 requires sustained growth, strong demand, and favorable macro conditions.
Can SUI Reach $10?
Reaching $10 would require significant ecosystem growth and large capital inflows. Only the most optimistic forecasts support this scenario in the near term. While possible, it depends on rapid adoption, strong partnerships, and overall crypto market expansion.
Can SUI Reach $50?
SUI reaching $50 would require massive long-term growth and global adoption. According to some projections, this level could be possible by 2040 or later. However, this scenario depends on strong demand, real-world utility, and a favorable crypto market over many years. It is possible, but highly ambitious.
Can SUI Reach $100?
A $100 SUI price would require extreme adoption and a major shift in the crypto market. Only the most aggressive forecasts support this scenario. It would likely take decades and depend on SUI becoming a leading blockchain platform with global usage.
Should I Buy SUI Coin in 2026?
Buying SUI in 2026 depends on your risk tolerance and strategy. SUI offers growth potential, but it also carries high volatility. If the ecosystem expands and adoption increases, the price may rise. However, short-term risks remain, so careful research is essential.
Will SUI Coin Go Up?
SUI may go up if the project continues to grow and attract users. Market cycles also play a major role. During bullish phases, SUI can rise quickly. However, during bearish periods, it may drop sharply. Long-term direction depends on adoption and market conditions.
How High Can SUI Go?
SUI’s potential depends on adoption, technology, and market demand. Conservative estimates suggest gradual growth, while aggressive forecasts show much higher levels. In the long term, SUI could reach several dollars or more, but exact limits remain uncertain.
Is SUI a Good Investment?
SUI can be a good investment for those who accept higher risk. It offers strong technology and growth potential, but it is still a developing project. Investors should consider both upside potential and downside risk before making a decision.
How Does Our Price Prediction for SUI Work?
Our SUI price prediction combines data from multiple sources, including DigitalCoinPrice, PricePrediction, and Telegaon. We also analyze technical indicators and market trends. This approach helps create balanced forecasts that include both conservative and optimistic scenarios.
How to Read and Predict SUI Price Movements?
Understanding SUI price prediction does not require complex tools, but it does require a clear system and discipline. Every market follows repeating cycles. These include accumulation, expansion, correction, and consolidation. When you recognize the current phase, you reduce emotional decisions and focus on probability.
SUI often reacts faster than large-cap coins because it is still developing. This means moves can be sharper in both directions. For beginners, the key is to stay consistent. Focus on structure, not noise. Track trends, confirm signals, and avoid guessing.
Sui Price Prediction Indicators
Technical indicators help measure momentum and trend strength in a simple way.
- RSI shows whether SUI is overbought or oversold. Values below 30 may suggest a potential rebound. Values above 70 often signal that the price may slow down or pull back.
- MACD tracks changes in momentum. When the MACD line crosses above the signal line, it may support upward movement. When it crosses below, it often confirms weakening strength.
- Moving averages define the trend direction. If SUI trades below key averages, sellers control the market. If price moves above them, buyers regain strength.
- Volume confirms the quality of moves. Strong volume supports breakouts. Low volume often signals weak or false moves.
How to Read Sui Charts and Predict Price Movements?
Start with trend identification. If SUI creates higher highs and higher lows, the trend is bullish. If it creates lower highs and lower lows, the trend is bearish.
Next, mark support and resistance zones. These areas often act as decision points. Price may bounce, reject, or break through them.
A breakout above resistance can signal continuation. A breakdown below support can lead to further decline. However, always confirm these moves with volume and indicators.
Also watch the broader market. SUI rarely moves independently. It often follows the overall crypto direction, especially Bitcoin.
What Affects the Price of SUI?
Bitcoin remains the strongest external factor. When Bitcoin rises, SUI often follows. When Bitcoin falls, SUI usually drops faster due to higher volatility.
Market sentiment also plays a major role. Positive news, ecosystem growth, and new partnerships can increase demand. Negative sentiment can quickly reduce interest.
Liquidity conditions matter as well. When capital flows into altcoins, SUI benefits. When investors move funds back into safer assets, SUI weakens.
Technology development and adoption also influence long-term price. More users and real use cases support higher valuations.
Bullish and Bearish Price Prediction Patterns
Price patterns help traders anticipate possible moves before they happen.
Bullish patterns suggest upward movement. Common examples include:
- Double bottom – price tests support twice and holds, which signals strength.
- Ascending triangle – price forms higher lows under resistance, which often leads to a breakout.
These patterns show growing buying pressure.
Bearish patterns suggest downward movement. Common examples include:
- Head and shoulders – price loses momentum after a peak.
- Descending triangle – price forms lower highs above support, which signals selling pressure.
These patterns often indicate that sellers are gaining control.
Understanding these structures helps you read the market more clearly and make better decisions based on probability instead of emotion.
How to Buy Sui (SUI): Quick-Step Guide
Buying SUI does not need to be complicated. You can use a non-custodial exchange like StealthEX to swap crypto quickly and privately. You do not need to create an account, and you keep full control of your funds.
StealthEX supports thousands of cryptocurrencies and allows direct wallet-to-wallet transfers. This makes the process simple and beginner-friendly.
Just follow these steps:
- Choose the crypto pair and enter the amount (for example, ETH to SUI).
- Click the “Start Exchange” button.
- Enter your SUI wallet address.
- Send funds to the provided deposit address.
- Receive SUI directly in your wallet.
The entire process usually takes a few minutes. It does not require registration or KYC, which improves privacy and speed.
Before you start, make sure your wallet supports SUI. Always double-check the address to avoid mistakes.

Follow us on Medium, X, Telegram, YouTube, and Publish0x to stay updated about the latest news on StealthEX.io and the rest of the crypto world.
Don’t forget to do your research before buying any crypto. The views and opinions expressed in this article are solely those of the author.
crypto price prediction cryptocurrency price analysis price prediction SUIThe post Sui Price Prediction 2026, 2027-2030 first appeared on StealthEX.]]>
As of June 2026, Bitcoin trades at around $60,500 after a volatile month. BTC reached a monthly high of about $74,000 on May 31 before dropping to a monthly low near $58,200 on June 25. These sharp moves highlight both Bitcoin’s growth potential and its price volatility.
Bitcoin also set a new all-time high of $126,198 in October 2025, proving that demand from both retail and institutional investors remains strong despite market corrections.
In this guide, you’ll explore Bitcoin price predictions for 2026–2030, learn what drives BTC’s value, and discover the key factors that could influence its future performance. So, let’s get started!
| Current BTC Price | BTC Price Prediction 2026 | BTC Price Prediction 2030 |
| $60,500 | $100,000 | $270,000 |
What Is Bitcoin (BTC)?
Bitcoin (BTC) is the world’s first cryptocurrency. It launched in 2009 after an anonymous person or group using the name Satoshi Nakamoto published the Bitcoin whitepaper and introduced a new type of digital money. Unlike traditional currencies, Bitcoin does not rely on banks or governments to process transactions. Instead, it runs on a decentralized blockchain that records every transaction on a public ledger.
The Bitcoin network uses a system called Proof-of-Work (PoW). In this process, specialized computers known as miners verify transactions and secure the blockchain. As a reward, miners receive newly created Bitcoin. This mechanism keeps the network secure while preventing anyone from changing past transactions.
One of Bitcoin’s most important features is its fixed supply of 21 million coins. Unlike fiat currencies, which central banks can print in unlimited amounts, Bitcoin has a hard cap built into its code. Many investors see this limited supply as protection against inflation, which has earned Bitcoin the nickname “digital gold.”
Bitcoin plays an even bigger role in the financial world in 2026 than it did just a few years ago. The approval of spot Bitcoin ETFs opened the market to a wider range of investors, including pension funds, asset managers, and public companies. At the same time, more businesses and institutions continue to add Bitcoin to their balance sheets or investment portfolios.
Today, Bitcoin is more than just a cryptocurrency. It has become a global financial asset, a long-term store of value for many investors, and the benchmark that often determines the direction of the entire crypto market.
Bitcoin Key Facts and Tokenomics
Bitcoin’s economic model is one of the main reasons investors consider it a valuable long-term asset. Unlike traditional currencies, Bitcoin has a maximum supply of 21 million coins, making it a scarce digital asset. As of June 2026, more than 20 million BTC are already in circulation, leaving fewer than 1 million coins to be mined.
Bitcoin also follows a built-in monetary policy called the halving. Approximately every four years, the mining reward is cut in half, slowing the rate at which new Bitcoin enters circulation. The latest halving took place in April 2024, reducing the block reward to 3.125 BTC. The next halving is expected around 2028, further decreasing the supply of newly mined coins.
| Metric | Value |
| Maximum Supply | 21 million BTC |
| Circulating Supply (June 2026) | ~20 million BTC |
| Consensus Mechanism | Proof-of-Work (PoW) |
| Current Block Reward | 3.125 BTC |
| Last Halving | April 2024 |
| Next Halving | Expected in 2028 |
What Drives Bitcoin’s Value?
Bitcoin’s price depends on several key factors. Some influence the market for years, while others create short-term volatility.
The main factors include:
- Supply and demand: Bitcoin has a fixed supply of 21 million coins. As demand increases and fewer new coins enter circulation, the price often rises.
- Institutional adoption: Investment from ETFs, asset managers, public companies, and large investors can significantly increase demand.
- Macroeconomic conditions: Interest rates, inflation, global liquidity, and economic uncertainty all affect investor behavior and risk appetite.
- Regulation: New laws, government policies, and crypto-friendly regulations can boost confidence, while restrictive rules may pressure prices.
- Market sentiment: News, social media, investor expectations, and overall market psychology often drive short-term price movements.
- Bitcoin halving: Every four years, the mining reward is cut in half, reducing the supply of new BTC entering the market. Historically, halvings have supported long-term price growth.
Bitcoin Price Today and Recent Performance
As of late June 2026, Bitcoin trades at around $60,000 after a sharp correction from its May highs. During the past month, BTC climbed to nearly $74,000 before falling to around $58,200, highlighting the cryptocurrency’s continued volatility. Despite the recent pullback, Bitcoin remains the largest cryptocurrency by market capitalization, accounting for about 55.6% of the total crypto market.
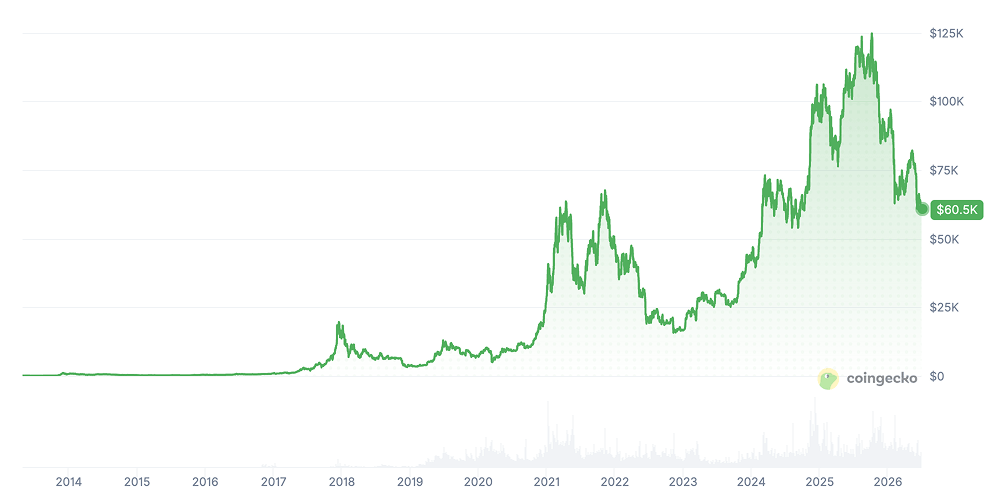
BTC Price Chart, CoinGecko, June 29, 2026
Trading activity also remains strong, with billions of dollars in daily trading volume across global exchanges. Bitcoin continues to attract both retail and institutional investors, although market sentiment has become more cautious following recent ETF outflows and changing expectations for U.S. interest rates.
While Bitcoin is trading well below its all-time high of $126,198, reached in October 2025, it remains one of the best-performing assets of the past decade.
Current BTC Price and Market Cap
As of late June 2026, Bitcoin trades at around $60,000, making it the largest cryptocurrency by market capitalization.
The current circulating supply stands at approximately 20.05 million BTC, meaning more than 95% of the maximum 21 million coins have already been mined. Bitcoin’s market capitalization is close to $1.2 trillion, while its 24-hour trading volume is around $30 billion. The cryptocurrency also maintains a market dominance of roughly 56%, showing that it still accounts for more than half of the total crypto market value.
| Metric | Value (June 2026) |
| Current Price | ~$60,500 |
| Market Capitalization | ~$1.21 trillion |
| 24h Trading Volume | ~$30 billion |
| Circulating Supply | ~20.05 million BTC |
| Maximum Supply | 21 million BTC |
| Bitcoin Dominance | ~56% |
Recent Events Affecting Bitcoin’s Price
Several major events shaped Bitcoin’s price in 2025 and 2026. These events affected investor confidence, market liquidity, and short-term volatility.
First, spot Bitcoin ETF flows became one of the most important price drivers. Strong inflows supported Bitcoin during several rallies, while heavy outflows in 2026 increased selling pressure and weakened sentiment. Citi estimated that ETF flows explained a large share of Bitcoin’s weekly price moves, which shows how important institutional demand has become.
Second, Bitcoin reached a new all-time high of $126,198 in October 2025. This milestone attracted global attention and confirmed that large investors still viewed BTC as a major long-term asset. However, the following correction also reminded beginners that Bitcoin can fall sharply after record highs.
Third, the U.S. Strategic Bitcoin Reserve announcement changed the political narrative around BTC. The U.S. government said it would hold seized Bitcoin as a reserve asset instead of selling it, which strengthened Bitcoin’s store-of-value image.
Fourth, institutional purchases continued to influence the market. Strategy, formerly MicroStrategy, remained the most visible corporate Bitcoin buyer, although concerns around its valuation and funding model added pressure during the 2026 downturn.
Fifth, Federal Reserve policy became a key macro factor. Higher inflation expectations and uncertainty around future rate decisions reduced demand for risk assets, including Bitcoin.
Sixth, U.S. crypto regulation stayed in focus. The CLARITY Act made progress, but delays in the Senate limited the positive impact on market sentiment.
Finally, Binance’s failure to secure a MiCA license before the EU deadline created fresh uncertainty in Europe. Since Binance is the largest crypto exchange, its regulatory setback added pressure to the broader market and reminded investors that exchange access still matters for Bitcoin liquidity.
Bitcoin Price Prediction for 2026
Bitcoin could experience another volatile year in 2026 as investors react to ETF flows, macroeconomic conditions, and institutional demand. Forecasts from leading prediction platforms vary widely, showing that analysts remain divided on how quickly Bitcoin can recover from its current correction. While conservative models expect only modest gains, bullish forecasts suggest Bitcoin could challenge or even surpass its previous all-time high before the end of the year.
Bitcoin Price Forecast June–December 2026
Forecasts for the second half of 2026 highlight two very different market outlooks. DigitalCoinPrice expects Bitcoin to move within a relatively narrow range, gradually rising from around $59,000 in June to approximately $64,200 by December. This model assumes stable market conditions, moderate institutional demand, and limited volatility.
PricePrediction.net presents a much more optimistic scenario. According to its forecast, Bitcoin could climb above $93,000 in September, exceed $125,000 in October, and finish the year between $129,754 and $144,567. This outlook assumes renewed ETF inflows, improving macroeconomic conditions, and stronger investor confidence.
Considering both models, a balanced forecast places Bitcoin in the $70,000–$100,000 range by the end of 2026. This scenario assumes steady demand without requiring another explosive bull market.
Bitcoin Price Prediction End of 2026: Bull and Bear Case
The bull case depends on several positive catalysts. Spot Bitcoin ETFs would need to return to strong net inflows, the Federal Reserve would likely begin lowering interest rates, and regulatory clarity in the United States would continue to improve. At the same time, institutional investors would need to keep accumulating Bitcoin while overall crypto sentiment strengthens. Under these conditions, BTC could finish 2026 between $120,000 and $145,000, closely matching the bullish forecasts from PricePrediction.net.
The bear case assumes the opposite. Continued ETF outflows, weaker economic growth, delayed crypto legislation, and tighter monetary policy could keep pressure on the market. If investor confidence remains weak, Bitcoin may trade close to its current levels and end the year between $58,000 and $65,000, in line with DigitalCoinPrice’s conservative outlook.
Although both scenarios remain possible, the most realistic Bitcoin outlook for the end of 2026 likely falls somewhere in the middle. Much will depend on institutional demand, global liquidity, and whether Bitcoin enters the next stage of its long-term market cycle.
Bitcoin Price History
Bitcoin has experienced one of the most remarkable price journeys in financial history. Since its launch in 2009, it has grown from an experimental digital currency worth almost nothing into a trillion-dollar asset held by millions of investors, public companies, and financial institutions.
For nearly two years after its creation, Bitcoin had little or no market value. In 2011, it reached $1 for the first time, proving that people were willing to buy and trade the new digital currency. Two years later, Bitcoin crossed $1,000, fueled by growing media attention and the first wave of retail investors.
The next major bull market arrived in 2017, when Bitcoin surged to almost $20,000. Although the rally ended with a sharp correction in 2018, it introduced cryptocurrencies to a global audience.
Bitcoin entered another historic cycle in 2020 and 2021 after the third halving reduced the supply of new coins. Institutional investors, corporate treasury purchases, and unprecedented monetary stimulus pushed BTC to a new all-time high of $69,000 in November 2021.
The following year brought one of the largest bear markets in Bitcoin’s history. Rising interest rates, the collapse of several crypto companies, and weaker investor sentiment caused Bitcoin to fall to around $16,000 in late 2022.
The market recovered strongly after the approval of spot Bitcoin ETFs and growing institutional demand. Bitcoin broke above $100,000 for the first time in late 2024, confirming the start of another major bull cycle. The rally continued into 2025, when BTC reached its current all-time high of $126,198 in October.
As of June 2026, Bitcoin trades around $60,000 following a significant market correction. Despite the decline, Bitcoin remains one of the best-performing assets of the past decade and continues to attract long-term investors who believe future halving cycles could drive further growth.
From $0 to ATH: Key Milestones
| Year | Milestone | Approx. Price |
| 2009 | Bitcoin network launched | $0 |
| 2011 | First time above $1 | $1 |
| 2012 | First Bitcoin halving | ~$12 |
| 2013 | First move above $1,000 | ~$1,000 |
| 2016 | Second halving | ~$650 |
| 2017 | First major bull market peak | ~$20,000 |
| 2020 | Third halving | ~$8,700 |
| 2021 | New all-time high | ~$69,000 |
| 2022 | Bear market bottom | ~$16,000 |
| 2024 | Break above $100,000 after ETF-driven rally | >$100,000 |
| Oct. 2025 | Current all-time high | $126,198 |
| Jun. 2026 | Current market price | ~$60,500 |
Bitcoin’s history closely follows its four-year halving cycle. Each halving reduces the supply of newly mined BTC, and every cycle has eventually produced a new all-time high, although past performance does not guarantee future results.
Bitcoin Price Performance by Halving Cycle
Bitcoin has completed four halving cycles, each producing a different level of growth as the market matured.
| Halving Cycle | Halving Date | Price at Halving | Cycle Peak | Approx. Gain |
| Cycle 1 | November 2012 | ~$12 | ~$1,163 (2013) | +9,500% |
| Cycle 2 | July 2016 | ~$650 | ~$19,700 (2017) | +2,900% |
| Cycle 3 | May 2020 | ~$8,700 | ~$69,000 (2021) | +690% |
| Cycle 4* | April 2024 | ~$63,800 | $126,198 (Oct. 2025) | +98%* |
*The fourth halving cycle is still in progress, so its final performance remains unknown.
Historically, each halving has reduced Bitcoin’s inflation rate and strengthened its scarcity. Although percentage gains have become smaller with every cycle as the market has grown, Bitcoin has continued to establish new record highs. The next halving is expected in 2028, and many long-term investors believe it could become another major catalyst for Bitcoin’s next bull market.
Bitcoin Price On-Chain Analysis
Bitcoin’s on-chain data shows a market under pressure, but not necessarily a market in full panic. Several key metrics suggest that short-term sellers remain active, while long-term investors still hold a large share of the supply.
Exchange data gives the first important signal. Binance’s Bitcoin reserves reportedly increased from about 617,000 BTC to 648,600 BTC between late April and early June 2026. Rising exchange reserves can create selling pressure because more coins sit on trading platforms. At the same time, CryptoQuant reported that miners sent 19,560 BTC to Binance on June 26, following an earlier June spike above 23,000 BTC. This shows that miner selling remains an important short-term risk.
Long-term holder behavior looks more mixed. Glassnode reported that Bitcoin traded near $60,000, while the True Market Mean sat around $77,200, meaning BTC traded at roughly a 15% discount to that on-chain level. Short-term holder MVRV improved from 0.81 to 0.90, but it remained below the 1.0 break-even level, which means many recent buyers still held unrealized losses.
Profitability metrics also show stress. Glassnode’s 30-day Realized Profit/Loss Ratio stood near 0.53, confirming that loss-taking still dominated market flows. Coinpedia also highlighted an MVRV-Z Score near 0.41, which places Bitcoin closer to an accumulation zone than an overheated cycle top.
Whale activity adds another layer. Santiment reported that whales offloaded about 21,881 BTC in early June, while large Bitcoin transactions above $100,000 hit 10,095 in one day later that month. This suggests active repositioning by large holders.
Overall, Bitcoin’s on-chain picture remains cautious but not broken. Miner inflows and exchange reserves create downside risk, yet low MVRV readings and stressed profitability metrics may also point to a potential long-term accumulation phase.
On-Chain Indicators and Market Sentiment
On-chain metrics provide a deeper view of Bitcoin’s market health by tracking investor behavior directly on the blockchain. Current data suggests that sentiment remains cautious, although several indicators show the market is moving closer to a potential accumulation zone.
One of the most closely watched metrics is the MVRV Z-Score, which measures whether Bitcoin is overvalued or undervalued relative to its historical cost basis. According to recent Glassnode research, the AVIV Z-Score reached -1.09 before recovering to -1.06, placing Bitcoin in an extreme discount zone compared to its long-term average. Historically, readings below zero have appeared during market bottoms rather than cycle peaks.
The Spent Output Profit Ratio (STH-SOPR) also highlights weak short-term sentiment. Glassnode reported that the STH-SOPR Z-Score fell to -1.86, close to the historical capitulation threshold of -2.0. This indicates that many recent buyers continue selling Bitcoin at a loss, although the market has not yet reached the extreme panic levels seen during previous bear-market bottoms.
Exchange data paints a mixed picture. Glassnode notes that Coinbase Premium remains negative, showing weaker institutional demand in the United States, while Binance continues to hold the largest BTC reserves among centralized exchanges. Meanwhile, more than 95% of short-term holder supply remains underwater, with only 3.3% of short-term supply currently in profit, far below the four-year average of 55%. Despite this weakness, long-term holders continue to control a historically large share of Bitcoin’s circulating supply, suggesting experienced investors are still holding rather than distributing their coins.
Institutional Demand and ETF Flows
Institutional adoption has become one of the strongest drivers of Bitcoin’s price since the approval of U.S. spot Bitcoin ETFs in January 2024. These products have made Bitcoin accessible to pension funds, wealth managers, hedge funds, and other professional investors without requiring direct custody of the asset. Since their launch, U.S. spot Bitcoin ETFs have attracted more than $50 billion in cumulative net inflows, making them one of the most successful ETF launches in financial history.
The market is increasingly dominated by BlackRock’s iShares Bitcoin Trust (IBIT) and Fidelity’s Wise Origin Bitcoin Fund (FBTC). Throughout 2026, these two funds captured the majority of new institutional inflows, often accounting for more than two-thirds of daily ETF purchases. Their scale, liquidity, and reputation have made them the preferred investment vehicles for large asset managers.
Corporate demand remains another important catalyst. Strategy (formerly MicroStrategy) continues to hold the world’s largest corporate Bitcoin treasury, while dozens of other public companies have added BTC to their balance sheets. Together with ETF issuers, corporate buyers now control a significant share of Bitcoin’s circulating supply, reducing the amount of BTC available on the open market.
Government adoption has also entered the conversation. In 2025, the United States announced the creation of a Strategic Bitcoin Reserve, confirming that seized Bitcoin would be retained rather than liquidated. While the reserve does not involve active market purchases, the announcement reinforced Bitcoin’s growing role as a strategic reserve asset.
Looking further ahead, institutional demand could become even more significant. According to ARK Invest’s Big Ideas 2026 report, Bitcoin’s market capitalization could reach $16 trillion by 2030, driven by ETF adoption, corporate treasuries, sovereign demand, and Bitcoin’s expanding role as digital gold. Such a valuation would imply a Bitcoin price of more than $700,000 per coin.
Bitcoin Technical Analysis
According to the latest monthly technical analysis from Investing.com, Bitcoin currently shows a Strong Sell signal. Technical indicators remain bearish despite several long-term trend indicators continuing to point upward. Overall, the market reflects cautious sentiment as Bitcoin trades well below its 2025 all-time high.
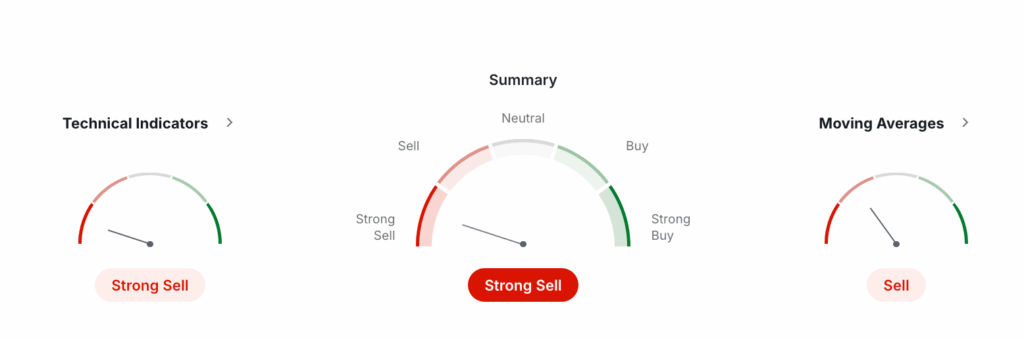
Investing, June 29, 2026
Key Support and Resistance Levels
Pivot points highlight the most important price zones where Bitcoin could find support or face renewed selling pressure.
The Classic Pivot Point stands at $76,327, which acts as the market’s primary equilibrium level. A sustained move above this price would strengthen bullish momentum, while trading below it keeps sellers in control.
Current support levels are:
- S1: $69,863
- S2: $66,067
- S3: $59,603
The $59,600–$60,000 area represents the strongest support zone and closely aligns with Bitcoin’s recent trading range. A break below this level could expose BTC to further downside.
Key resistance levels include:
- R1: $80,123
- R2: $86,587
- R3: $90,383
A breakout above $80,000 would improve the short-term outlook and could open the path toward the mid-$80,000 range.
Fibonacci pivot levels reinforce this analysis. They identify major support near $66,067 and resistance around $80,246 and $82,668, creating an important resistance cluster between $80,000 and $86,500. This zone will likely determine whether Bitcoin begins a sustained recovery or remains in consolidation.
Moving Averages and Oscillators
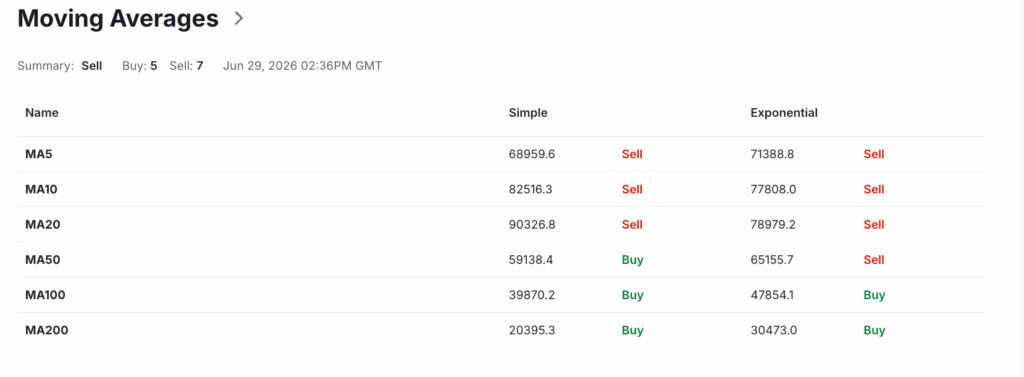
Investing, June 29, 2026
Monthly data from Investing continues to show short-term weakness but long-term strength. Short-term moving averages (MA5, MA10, and MA20) all generate Sell signals because Bitcoin remains below its recent trend levels. In contrast, the MA100 and MA200 continue to signal Buy, confirming that the broader long-term trend remains positive despite recent volatility. Overall, moving averages generate 5 Buy signals and 7 Sell signals, resulting in a Sell rating.
Oscillators also point to cautious market sentiment. RSI (14) stands at 40.78, indicating weak momentum without reaching oversold territory. MACD (12,26) remains one of the few bullish indicators with a Buy signal, while StochRSI is deeply oversold at 0.00, suggesting that selling pressure may be becoming exhausted. However, indicators such as CCI (-118.70), ROC (-36.76), Williams %R (-57.35), and the Ultimate Oscillator (33.58) all continue to signal Sell. Overall, Bitcoin’s technical picture remains bearish in the short term, although several long-term indicators suggest the broader uptrend is still intact.
Bitcoin Price Prediction 2026–2030
| Year | Minimum Price | Maximum Price | Average Price | Price Change |
| 2026 | $56,977 | $144,567 | $100,000 | +65% |
| 2027 | $61,519 | $206,553 | $130,000 | +115% |
| 2028 | $70,261 | $289,986 | $180,000 | +200% |
| 2029 | $94,877 | $351,724 | $220,000 | +265% |
| 2030 | $109,632 | $434,504 | $270,000 | +345% |
Bitcoin Price Prediction 2026
- According to DigitalCoinPrice, Bitcoin could trade between $58,989 (-2%) and $64,206 (+6%) in 2026, suggesting limited upside and a consolidation phase near the current $60,000 level.
- PricePrediction.net is far more bullish, forecasting BTC between $56,977 (-6%) and $144,567 (+140%).
- Telegaon also expects stronger momentum, placing Bitcoin between $78,402 (+30%) and $132,026 (+120%).
Bitcoin Price Prediction 2027
- DigitalCoinPrice expects Bitcoin to move between $61,519 (+2%) and $82,480 (+36%) in 2027.
- PricePrediction.net gives a wider and higher range, from $92,111 (+55%) to $144,854 (+140%).
- Telegaon remains the most bullish source, forecasting BTC between $133,125 (+120%) and $206,553 (+240%).
Bitcoin Price Prediction 2028
Bitcoin price prediction 2028 is especially important because 2028 is the next Bitcoin halving year. Historically, halvings reduce the rate of new BTC issuance and have often preceded the strongest phases of previous bull markets. While past performance never guarantees future returns, the event is expected to be one of the biggest long-term catalysts for Bitcoin.
- DigitalCoinPrice forecasts BTC between $70,261 (+17%) and $99,453 (+65%).
- PricePrediction.net sees a stronger cycle, with Bitcoin ranging from $101,917 (+70%) to $174,370 (+190%).
- Telegaon gives the most aggressive forecast, placing BTC between $207,536 (+240%) and $289,986 (+380%).
Bitcoin Price Prediction 2029
- DigitalCoinPrice predicts Bitcoin between $94,877 (+60%) and $112,119 (+85%).
- PricePrediction.net projects a much higher range of $166,820 (+180%) to $244,839 (+310%).
- Telegaon is even more bullish, estimating BTC between $291,841 (+380%) and $351,724 (+480%).
Bitcoin Price Prediction 2030
- DigitalCoinPrice expects Bitcoin to reach $109,632 (+85%) to $135,665 (+125%) by 2030.
- PricePrediction.net forecasts a range between $181,663 (+205%) and $248,523 (+310%).
- Telegaon offers the most optimistic outlook, placing BTC between $352,330 (+480%) and $434,504 (+630%).
Supporting the long-term bull case, ARK Invest stated in May 2026 that Bitcoin could eventually reach a $16 trillion market capitalization, highlighting continued institutional conviction in the asset’s long-term potential.
Bitcoin Long-Term Price Prediction 2030–2040
While short-term Bitcoin forecasts vary widely, long-term projections become even more dependent on global adoption, regulation, institutional investment, and macroeconomic conditions. By the 2030s, Bitcoin will go through an additional halving cycle, further reducing the rate of new supply. If demand continues to grow while supply remains increasingly scarce, many analysts believe BTC could establish itself as a global store of value alongside gold. However, investors should remember that long-term forecasts remain speculative and are heavily influenced by future technological, economic, and regulatory developments.
Bitcoin Price Prediction 2035
DigitalCoinPrice remains relatively conservative, forecasting Bitcoin between $162,177 (+170%) and $165,505 (+180%) based on its long-term model extending into the mid-2030s.
PricePrediction.net expects significantly stronger appreciation. Its 2035 forecast places Bitcoin between $357,578 (+500%) and $442,186 (+630%), reflecting continued institutional adoption and increasing demand for scarce digital assets.
Telegaon offers the most optimistic outlook, projecting Bitcoin between $672,424 (+1,000%) and $753,123 (+1,150%). Such valuations assume Bitcoin becomes one of the world’s dominant reserve assets and attracts substantial institutional capital over the next decade.
Bitcoin Price Prediction 2040
DigitalCoinPrice forecasts Bitcoin trading between $162,177 (+170%) and $167,823 (+180%) by 2040, suggesting a mature market with slower long-term appreciation.
Telegaon remains highly bullish, estimating Bitcoin between $904,543 (+1,400%) and $981,512 (+1,520%). This scenario assumes widespread global adoption, continued institutional demand, and Bitcoin evolving into a mainstream store of value across both public and private markets.
Will Bitcoin Reach $1 Million?
A Bitcoin price of $1 million is no longer considered an unrealistic long-term scenario by several prominent market participants. Cathie Wood of ARK Invest has repeatedly argued that continued institutional adoption and Bitcoin’s role as digital gold could eventually support a seven-figure valuation. Michael Saylor has also maintained that Bitcoin’s fixed supply gives it the potential to absorb a meaningful share of global wealth over time.
Current forecast models remain more conservative. Even Telegaon’s 2040 estimate tops out below $1 million at approximately $981,512, although it comes remarkably close. Reaching $1 million would require Bitcoin’s market capitalization to exceed $20 trillion, meaning continued adoption by governments, corporations, financial institutions, and retail investors. While such a valuation cannot be ruled out over the coming decades, it would likely require Bitcoin to become one of the world’s largest global financial assets rather than simply another investment.
Expert and Analyst Bitcoin Price Targets
The latest Bitcoin predictions from major institutions show a wide gap between cautious 2026 targets and highly bullish long-term forecasts. This range reflects the current market environment: Bitcoin is under pressure in 2026, but many analysts still expect institutional adoption to support higher prices over time.
ARK Invest remains one of the most bullish institutional voices. In 2026, ARK repeated that Bitcoin could reach $300,000 to $1.5 million by 2030, depending on ETF adoption, corporate treasury demand, sovereign interest, and Bitcoin’s role as digital gold. CoinDesk also reported ARK’s May 2026 view that Bitcoin’s market cap could reach $16 trillion by 2030.
Citi became more cautious in March 2026. The bank lowered its 12-month Bitcoin target from $143,000 to $112,000, citing slower U.S. crypto legislation, weaker ETF expectations, and softer market activity. However, Citi still kept a bullish scenario of $165,000 if investor demand improves.
JPMorgan’s model remains more optimistic. Its analysts argued that Bitcoin could reach $170,000 within six to twelve months because BTC looked undervalued compared with gold on a volatility-adjusted basis.
Galaxy Digital gives a mixed view. The firm said 2026 remains difficult to forecast, but it still sees Bitcoin reaching $250,000 by the end of 2027 if adoption continues.
VanEck focuses on the long term rather than short-term timing. Its January 2026 research projected a $2.9 million Bitcoin valuation by 2050 under its base-case long-term model.
Institutional Forecasts
Institutional forecasts for Bitcoin differ significantly because each firm uses different assumptions about ETF demand, monetary policy, and global adoption. While short-term targets became more conservative during the 2026 correction, most institutions remain bullish over the long term.
| Institution | Price Target | Timeline | Basis |
| ARK Invest | $300,000–$1.5 million | 2030 | Institutional adoption, sovereign demand, ETF growth, digital gold thesis |
| Standard Chartered | $100,000 | End of 2026 | ETF inflows recover, Strategy resumes buying, macro stabilization |
| Bernstein | $150,000 | End of 2026 | Elongated Bitcoin cycle, institutional demand, ETF accumulation |
| Citigroup | $112,000 (Base)$165,000 (Bull) | 12 months | Regulatory progress, ETF demand, improving market sentiment |
| JPMorgan | $170,000 | 6–12 months | Bitcoin undervalued relative to gold on a volatility-adjusted basis |
| Bitcoin Suisse | $150,000–$180,000 | 2026 | Fed easing, improving liquidity, institutional adoption |
| Galaxy Digital | $250,000 | End of 2027 | Continued ETF growth and corporate treasury demand |
| VanEck | $2.9 million | 2050 | Long-term capital market assumptions, reserve asset adoption |
Although the price targets vary widely, every institution expects Bitcoin’s long-term performance to depend primarily on institutional adoption, ETF inflows, and the continued reduction of available supply after future halving events.
What Analysts Say: Bull vs Bear Scenarios
| Bull Case | Bear Case |
| ARK Invest believes ETF adoption, sovereign accumulation, and institutional investment could push Bitcoin toward a multi-hundred-thousand-dollar valuation by 2030. | Standard Chartered warned that persistent ETF outflows and weak macroeconomic conditions could delay Bitcoin’s recovery despite its positive long-term outlook. |
| Bernstein argues Bitcoin has already established a market bottom and expects institutional demand, particularly from Strategy and spot ETFs, to drive the next rally. | Citi believes slower regulatory progress and weaker institutional inflows could limit Bitcoin’s upside until market conditions improve. |
| Bitcoin Suisse expects lower interest rates and improving liquidity to support new all-time highs as investor risk appetite returns. | Some macro analysts warn that prolonged high interest rates, recession risks, or tighter financial conditions could continue reducing demand for speculative assets such as Bitcoin. |
| Michael Saylor maintains that Bitcoin’s fixed supply gives it the potential to become one of the world’s largest stores of value over the coming decades. | Several analysts also point to regulatory uncertainty and continued ETF redemptions as the biggest risks that could postpone the next bull market. |
The consensus among institutional analysts remains constructive despite recent volatility. Most expect Bitcoin to recover over time, but they also agree that the pace of ETF inflows, monetary policy, and global adoption will determine whether the next major rally begins in 2026 or later.
Should You Buy Bitcoin in 2026?
Whether Bitcoin is a good investment in 2026 depends on your financial goals, risk tolerance, and investment horizon. Bitcoin remains the largest cryptocurrency and continues to attract institutional investors, governments, and public companies. However, it is also a highly volatile asset that can experience sharp price swings over short periods.
The current market presents both opportunities and risks. On one hand, Bitcoin continues to benefit from growing institutional adoption, expanding ETF participation, and its limited supply of 21 million coins. On the other hand, investors still face macroeconomic uncertainty, changing regulations, and periods of significant market volatility.
For long-term investors, Bitcoin may serve as a portfolio diversification tool and a potential hedge against currency debasement. However, beginners should avoid investing more than they can afford to lose and should consider building a position gradually instead of trying to time the market.
Bullish Case for BTC
Several factors support a positive long-term outlook for Bitcoin. One of the biggest catalysts is the continued growth of spot Bitcoin ETFs, which have attracted tens of billions of dollars since launching in 2024. These investment products make Bitcoin easier to access for pension funds, asset managers, and other institutional investors.
The next Bitcoin halving, expected in 2028, could become another important catalyst. Historically, every halving has reduced the supply of newly mined BTC and has eventually been followed by a major bull market.
Institutional adoption also continues to expand. Companies such as Strategy maintain large Bitcoin holdings, while major asset managers like BlackRock and Fidelity continue offering spot Bitcoin ETFs. In addition, the creation of the U.S. Strategic Bitcoin Reserve strengthened Bitcoin’s position as a strategic digital asset. Regulatory progress, including the advancement of the CLARITY Act, could further increase investor confidence by providing clearer rules for the crypto industry.
Bearish Risks to Consider
Despite its long-term potential, Bitcoin remains a high-risk investment. Regulatory uncertainty continues to be one of the biggest concerns. Although some countries have adopted crypto-friendly policies, stricter regulations or outright restrictions could reduce demand and slow adoption.
Macroeconomic conditions also play a major role. Higher interest rates, persistent inflation, or a global recession could push investors toward safer assets and reduce demand for cryptocurrencies. At the same time, continued ETF outflows may increase selling pressure and weaken market sentiment.
Bitcoin also faces several long-term challenges. Advances in quantum computing could eventually require major security upgrades, although most experts believe this risk remains years away. The market also remains vulnerable to manipulation by large holders, commonly known as whales, whose transactions can trigger sharp price swings.
Finally, governments around the world continue developing central bank digital currencies (CBDCs). While CBDCs are fundamentally different from Bitcoin because they are centralized, their wider adoption could influence how digital payments evolve and compete for public attention. Investors should carefully weigh these risks alongside Bitcoin’s long-term growth potential before making an investment decision.
How to Buy Bitcoin
StealthEX allows you to swap Bitcoin quickly and privately. You do not need to create an account. The platform supports more than 2,000 cryptocurrencies and works with direct wallet-to-wallet transfers.
Just follow these steps:
- Choose the crypto pair and enter the amount (for example, ETH to BTC).
- Click the “Start Exchange” button.
- Enter your Bitcoin wallet address.
- Send the funds to the provided deposit address.
- Receive BTC directly in your wallet.

That’s it. The entire process usually takes only a few minutes and does not require registration.
Frequently Asked Questions
What Is the Bitcoin Price Prediction for 2026?
Bitcoin price predictions for 2026 vary significantly depending on the forecasting model. DigitalCoinPrice expects BTC to trade between $58,989 and $64,206, suggesting a year of gradual growth. PricePrediction.net is much more optimistic, forecasting a range of $56,977 to $144,567, while Telegaon projects $78,402 to $132,026. A balanced outlook places Bitcoin between $70,000 and $100,000 by the end of 2026 if institutional demand remains strong and macroeconomic conditions improve.
How High Can Bitcoin Go in 2030?
Long-term forecasts suggest Bitcoin could reach new all-time highs by 2030. DigitalCoinPrice predicts a maximum price of $135,665, while PricePrediction.net expects BTC to climb as high as $248,523. Telegaon offers the most optimistic forecast at $434,504. Some institutional investors, including ARK Invest, believe Bitcoin could eventually trade far above these levels if global adoption continues, although such scenarios depend on sustained institutional demand and favorable market conditions.
Will Bitcoin Go Up in 2026?
Many analysts believe Bitcoin has the potential to recover during 2026, although volatility is likely to remain high. Spot Bitcoin ETFs continue attracting institutional capital, public companies keep adding BTC to their balance sheets, and regulatory clarity in the United States has improved compared to previous years. At the same time, Bitcoin remains well below its October 2025 all-time high, leaving room for recovery if investor confidence strengthens. However, risks such as weaker economic growth, ETF outflows, and higher interest rates could delay the next bull market. Most forecasts remain cautiously optimistic, expecting Bitcoin to finish 2026 above its current price despite continued short-term fluctuations.
What Will Bitcoin Be Worth in 2030?
No one can predict Bitcoin’s future price with certainty, but most long-term forecasts remain positive. Current models project Bitcoin between $109,632 and $434,504 by 2030, depending on the source. Conservative forecasts assume moderate adoption and slower market growth, while bullish scenarios expect stronger ETF inflows, institutional investment, and another successful halving cycle. If Bitcoin continues gaining acceptance as a global store of value, its long-term upside could exceed today’s mainstream forecasts.
How Much Will Bitcoin Be Worth in 2040?
Forecasts for 2040 remain highly speculative because they depend on future adoption, regulation, and global economic conditions. DigitalCoinPrice estimates Bitcoin could trade between $162,177 and $167,823, while Telegaon projects a much higher range of $904,543 to $981,512. Some analysts also believe Bitcoin could eventually surpass $1 million, although reaching that level would likely require widespread institutional, corporate, and sovereign adoption.
Is Bitcoin a Good Investment in 2026?
Bitcoin may be a suitable investment for people with a long-term perspective and a high tolerance for risk. It benefits from a limited supply, growing institutional adoption, and increasing acceptance as a store of value. However, Bitcoin remains highly volatile, and large price corrections can occur without warning. Investors should only invest money they can afford to lose, diversify their portfolios, and avoid making decisions based solely on short-term market movements.
Where Is Bitcoin Headed?
Bitcoin’s short-term direction depends largely on ETF flows, interest rate decisions, and overall investor sentiment. By the end of 2026, many analysts expect BTC to recover if institutional demand strengthens and macroeconomic conditions improve. Looking further ahead, the 2028 Bitcoin halving could become the next major catalyst, as previous halving cycles have often preceded new all-time highs. Beyond 2030, Bitcoin’s future will depend on global adoption by institutions, corporations, governments, and retail investors. If demand continues to increase while Bitcoin’s supply remains limited, many analysts believe the long-term trend will remain positive despite periods of significant volatility.
Follow us on Medium, X, Telegram, YouTube, and Publish0x to stay updated about the latest news on StealthEX.io and the rest of the crypto world.
Don’t forget to do your own research before buying any crypto. The views and opinions expressed in this article are solely those of the author.
Bitcoin Bitcoin price prediction BTC crypto price prediction price analysisThe post Bitcoin (BTC) Price Prediction 2026–2030: How High Can BTC Go? first appeared on StealthEX.]]>
At the moment, Official Trump trades around $1.7. During the last month, the token reached a local low near $1.5 on June 6, while the monthly high formed around $2.36 on June 13. This price range shows how quickly sentiment can change in the meme coin market. Even small news events, political headlines, or whale activity can move the token sharply in either direction.
In this guide, you will discover detailed Official Trump (TRUMP) price predictions for 2026, 2027, 2030, 2040, and 2050. You will also learn how technical indicators work, which price levels traders watch most closely, and what factors could influence the future of TRUMP coin. So, let’s get started!
| Current TRUMP Price | TRUMP Price Prediction 2026 | TRUMP Price Prediction 2030 |
| $1.7 | $3.5 | $12 |
What Is TRUMP Coin? Key Facts for 2026
OFFICIAL TRUMP (TRUMP) is a meme cryptocurrency built on the Solana blockchain. The project launched on January 17, 2025, just a few days before Donald Trump began his second presidential term. Unlike many meme coins that appear without any public connection to the people they reference, TRUMP was introduced as the official token associated with President Donald Trump and his brand.
The project quickly attracted global attention because it combined politics, internet culture, and cryptocurrency. Millions of people who had never bought a meme coin before suddenly became interested in TRUMP. As a result, trading volume exploded within days, and the token became one of the biggest crypto launches in recent years.
Although TRUMP belongs to the meme coin category, it differs from many competitors. Most meme coins rely only on community hype or viral social media trends. TRUMP, however, benefits from one of the world’s most recognizable public figures. News related to Donald Trump, political events, public appearances, and community campaigns have repeatedly influenced the token’s price.
By 2026, TRUMP remains one of the largest political meme coins on the market. It is listed on several major cryptocurrency exchanges and continues to attract active traders. However, it has also become much more volatile after the excitement surrounding its launch faded. Large token unlocks, changing market sentiment, and the natural cooling of the meme coin sector have all contributed to significant price swings.
For beginners, it is important to understand that TRUMP is not an official government currency or investment product. It is a cryptocurrency whose value depends almost entirely on market demand, investor sentiment, and ongoing public interest in Donald Trump and the broader meme coin market.
TRUMP Coin Tokenomics and Supply
TRUMP has a maximum supply of 1 billion tokens, making its tokenomics easy to understand. At launch in January 2025, only 200 million TRUMP (20%) entered circulation through public distribution and liquidity pools. The remaining 800 million tokens (80%) were allocated to Trump-affiliated entities, including CIC Digital LLC and related organizations. These tokens were locked and scheduled for gradual release over several years rather than entering the market all at once.
The project uses a combination of cliff unlocks and linear vesting. After an initial lock-up period, portions of the reserved tokens began unlocking at regular intervals. This approach reduces the chance of one massive supply shock, but it still increases the circulating supply over time. As of June 2026, around 237 million TRUMP tokens are in circulation, while the remaining supply continues to unlock according to the official vesting schedule, which extends into 2028.
For investors, token unlocks are one of the most important factors to monitor. Every new release increases the number of tradable tokens, which can create additional selling pressure if recipients decide to take profits. While unlocks do not automatically cause price drops, they often increase volatility and can weigh on the market when overall demand is weak. Understanding the vesting schedule is therefore essential before making any long-term investment decision.
TRUMP vs Trump NFTs vs Trump Gold Coins: What’s the Difference?
Many beginners assume that every Trump-branded digital or physical collectible belongs to the same project. In reality, these are three completely different products with different purposes, blockchains, and values.
| Feature | OFFICIAL TRUMP Coin | Trump Digital Trading Cards (NFTs) | Trump Gold Coins |
| Type | Cryptocurrency | NFT collection | Physical collectible |
| Blockchain | Solana | Polygon | None |
| Launch | January 2025 | December 2022 | Various licensed editions |
| Purpose | Trading, investing, ecosystem participation | Digital collectibles with ownership rights | Memorabilia and collectibles |
| Current Value* | Market price varies by exchange | Floor price varies by collection | Depends on metal content and rarity |
The OFFICIAL TRUMP (TRUMP) token is a cryptocurrency that trades on crypto exchanges. Investors buy and sell it just like Bitcoin or other digital assets, and its price changes every second based on market demand. It also serves as the native token for Trump-related promotions and ecosystem activities.
By contrast, Trump Digital Trading Cards are NFTs issued on the Polygon blockchain. Each NFT represents a unique digital collectible featuring Donald Trump in different themed artworks. Their value depends on rarity, collector demand, and marketplace activity rather than token price.
Finally, Trump Gold Coins are physical commemorative collectibles. They are not cryptocurrencies and have no blockchain connection. Their value comes from factors such as precious metal content, limited editions, craftsmanship, and collector interest. Some officially licensed versions are sold directly through Trump-branded merchandise channels.
TRUMP Coin Price History and Performance
OFFICIAL TRUMP has had one of the most volatile price journeys in the crypto market. The token launched at around $0.4 in January 2025, surged to an all-time high of $73.43 within two days, and then entered a prolonged decline. As of late June 2026, TRUMP trades around $1.7, meaning it has lost more than 95% of its peak value. Despite this sharp correction, it remains one of the largest political meme coins by market capitalization.
From Launch to ATH: $0.4 → $73.43
OFFICIAL TRUMP launched on January 17, 2025, just days before Donald Trump’s second presidential inauguration. The token debuted on the Solana blockchain at approximately $0.4 and immediately attracted worldwide attention after Trump promoted it on Truth Social and X. Strong media coverage, limited initial circulating supply of 200 million tokens, and massive retail demand fueled an extraordinary rally. On January 19, 2025, TRUMP reached its all-time high of $73.43, giving the project a fully diluted valuation of more than $70 billion. The launch quickly became one of the biggest meme coin success stories in crypto history.
The Crash: Why TRUMP Lost 95% from Its Peak
The rally proved difficult to sustain. As the initial excitement faded, many early investors locked in profits, while the broader meme coin market also cooled. At the same time, the project’s token unlock schedule gradually increased the circulating supply, creating additional selling pressure.
In May 2025, an exclusive Trump dinner for top token holders briefly boosted sentiment, but the effect lasted only a short time. A year later, the Billionaire Game campaign once again attracted headlines, yet many investors criticized it for encouraging speculation rather than long-term adoption.
Combined with regular token unlocks and weaker market demand, these events pushed TRUMP steadily lower. Even so, the coin still retains value and continues to trade actively on major exchanges, proving that investor interest has not disappeared completely.
TRUMP Coin Price Chart and Historical Data
The TRUMP price chart clearly illustrates a classic meme coin cycle: a rapid launch, an explosive rally, and a long correction. When reviewing the chart below, pay close attention to the January 2025 peak, major token unlock dates, and the recovery attempts following key Trump-related events. These milestones help explain why the token has remained highly volatile since its launch.
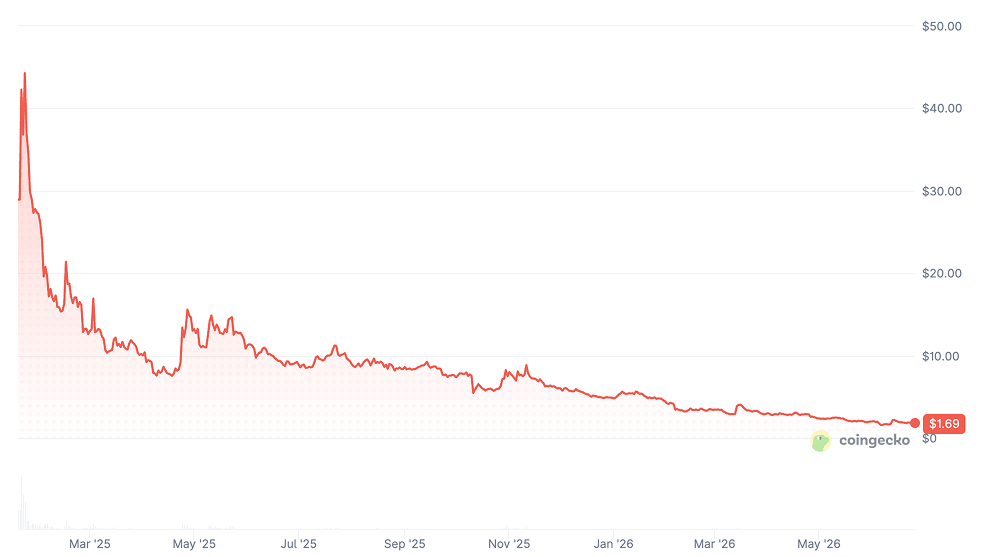
CoinGecko, June 25, 2026
Is TRUMP Coin Worth Anything in 2026?
Yes. TRUMP Coin still has significant value in 2026, although it trades far below its record high. As of late June 2026, the token has a market capitalization of around $402 million, placing it among the larger meme cryptocurrencies. However, its price remains roughly 97% below the all-time high of $73.43 reached in January 2025.
This shows that while the initial hype has faded, the project still has an active community, strong trading volume, and listings on major exchanges. TRUMP remains a highly speculative asset, so investors should expect substantial price volatility and carefully manage their risk.
Current Price and Market Cap
As of June 25, 2026, OFFICIAL TRUMP continues to rank among the largest meme coins despite trading far below its all-time high.
| Metric | Value |
| Price | $1.69 |
| Market Cap | $401,748,761 |
| 24h Trading Volume | $201,170,994 |
| CoinMarketCap Rank | #87 |
| Circulating Supply | 237,413,140 TRUMP |
| Max Supply | 1,000,000,000 TRUMP |
On-Chain Data and Market Sentiment
TRUMP still shows active on-chain demand, but the data looks much weaker than during its launch mania. Solscan shows around 648,000 holders, which means the token keeps a large holder base even after a deep price decline. This separates TRUMP from smaller political meme coins that often lose liquidity and holders quickly after the first hype cycle.
Solscan, June 25, 2026
Social activity also remains event-driven. Santiment tracks crypto social volume across major discussion channels, and TRUMP usually gets attention spikes when Donald Trump, token unlocks, or holder campaigns enter the news. However, these spikes tend to fade fast, which shows that sentiment depends more on headlines than long-term utility.
Large transactions also matter. In March 2026, Arkham data cited by CoinDesk showed one wallet buying about 2.2 million TRUMP, worth roughly $7 million, after a gala-related announcement. That type of whale activity can move sentiment quickly, but it also increases risk because large holders can sell just as aggressively.
Key Factors That Drive TRUMP Price
Several key factors influence OFFICIAL TRUMP price movements. Unlike utility-focused cryptocurrencies, TRUMP depends heavily on investor sentiment, political news, and overall market conditions.
Bitcoin remains the biggest external driver. When Bitcoin enters a strong bull market, investors usually become more willing to buy higher-risk assets such as meme coins. During market corrections, TRUMP often falls faster because speculative capital leaves the market first.
Political events also have a direct impact. Presidential speeches, election campaigns, legal developments, interviews, or major headlines involving Donald Trump can quickly change market sentiment. Few cryptocurrencies are as closely tied to a single public figure.
Social media activity is another major catalyst. Viral discussions on X, Reddit, TikTok, Telegram, and YouTube can generate sudden buying pressure, especially when influencers or well-known traders mention the token.
Other factors that can affect the TRUMP price include:
- Token unlocks and increases in circulating supply
- Whale buying and selling activity
- Exchange listings or delistings
- Liquidity and trading volume
- Meme coin market momentum
- Retail investor sentiment
- Overall cryptocurrency market trends
- Community campaigns and Trump-related promotional events
TRUMP Coin Technical Analysis
According to the latest monthly technical data from Investing.com, the overall outlook for OFFICIAL TRUMP remains Strong Sell. The indicator summary shows 5 Sell signals and no Buy signals, while the moving averages are even weaker, with 10 Sell signals versus only 2 Buy signals. This combination suggests that bearish momentum still dominates the market.
Several momentum indicators confirm the downtrend. RSI (14) stands at 12.63, placing TRUMP deep in oversold territory after months of heavy selling. Stochastic (11.99) and Williams %R (-98.6) also signal oversold conditions, while MACD (-0.357) and CCI (-116.85) continue to generate Sell signals. Although oversold readings sometimes precede a rebound, they do not guarantee that a trend reversal will happen immediately.
At the same time, ADX (92.71) indicates that the current trend remains extremely strong. In this case, that trend is still bearish. Investors should therefore wait for improving momentum before interpreting oversold indicators as a bullish signal.
Key Support and Resistance Levels
The current Classic Pivot Point sits at 2.14, making it the key level to watch in the coming weeks. Trading below this level keeps sellers in control, while a move above it could improve short-term sentiment.
Support levels:
- S1: 1.70
- S2: 1.39
- S3: 0.96
If TRUMP falls below $1.70, the next downside targets are around $1.39 and $0.96.
Resistance levels:
- R1: 2.45
- R2: 2.89
- R3: 3.20
A breakout above $2.45 would be the first sign that buyers are regaining control. The next major resistance zone lies between $2.89 and $3.20.
Both Fibonacci and Camarilla pivot levels cluster around the $2.14–$2.43 area, reinforcing this region as the most important short-term resistance zone. A sustained move above these levels would strengthen the bullish case.
Moving Averages and Oscillators
The moving averages continue to reflect a weak market structure. Short-term and medium-term moving averages remain on Strong Sell, indicating that sellers still control the trend. Only the 100-day and 200-day Simple Moving Averages continue to generate Buy signals, suggesting that the longer-term structure has not completely broken down.
| Moving Average | Simple MA | Signal | Exponential MA | Signal |
| MA5 | 2.517 | Sell | 2.712 | Sell |
| MA10 | 4.301 | Sell | 4.510 | Sell |
| MA20 | 7.050 | Sell | 8.668 | Sell |
| MA50 | 2.820 | Sell | 15.278 | Sell |
| MA100 | 1.410 | Buy | 19.061 | Sell |
| MA200 | 0.705 | Buy | 21.411 | Sell |
Oscillators paint a similar picture. MACD, CCI, ROC, and Bull/Bear Power all remain bearish, while RSI, Stochastic, and Williams %R show deeply oversold conditions after the recent decline. This combination often appears near local bottoms, but confirmation from improving momentum is still missing.
Overall, the technical picture favors caution. The long-term trend still has some support, but the short-term outlook remains bearish until TRUMP reclaims key resistance levels and technical indicators begin shifting toward Neutral or Buy.
TRUMP Coin Price Prediction 2026–2030
| Year | Minimum Price | Maximum Price | Average Price | Price Change |
| 2026 | $1.24 | $6.2 | $3.5 | +105% |
| 2027 | $2.05 | $8.42 | $5 | +195% |
| 2028 | $2 | $10.18 | $6 | +255% |
| 2029 | $2.42 | $16.86 | $9 | +430% |
| 2030 | $2.5 | $22.25 | $12 | +610% |
TRUMP Price Prediction 2026
DigitalCoinPrice expects OFFICIAL TRUMP to trade between $1.65 (-2%) and $2.95 (+75%) during 2026. The forecast points to a gradual recovery rather than an explosive rally, with the highest prices expected in the third quarter before the token stabilizes toward year-end.
PricePrediction.net is significantly more optimistic. Its model forecasts TRUMP between $1.24 (-25%) and $6.2 (+265%) by December 2026. This scenario assumes renewed interest in meme coins, stronger retail participation, and sustained community engagement throughout the year.
Telegaon offers a bullish long-term outlook for 2026. According to its estimates, TRUMP could trade between $2.69 (+60%) and $5.63 (+235%), suggesting that favorable market conditions and continued political attention could drive substantial upside.
TRUMP Price Prediction 2027
DigitalCoinPrice forecasts another year of moderate growth, with OFFICIAL TRUMP trading between $2.24 (+35%) and $3.22 (+90%) in 2027. The model suggests that price appreciation may continue steadily as long as market sentiment toward meme coins remains positive.
PricePrediction.net expects greater volatility during 2027. Its projections range from $2.05 (+20%) to $5.49 (+225%), indicating that TRUMP could experience a correction after a strong 2026 before recovering later in the year.
Telegaon remains the most bullish source. It predicts TRUMP could trade between $5.72 (+240%) and $8.42 (+400%), reflecting expectations of another strong meme coin cycle supported by speculative demand and an active community.
TRUMP Coin Price Prediction 2028–2029
DigitalCoinPrice expects TRUMP to remain relatively stable over the next two years. During 2028, prices are projected between $2 (+20%) and $3.23 (+90%), while 2029 forecasts range from $2.42 (+43%) to $3.13 (+85%). This outlook suggests slower growth after the initial recovery phase.
PricePrediction.net paints a much more bullish picture. For 2028, it forecasts prices between $2.22 (+30%) and $6.07 (+260%). In 2029, the model expects TRUMP to climb further, trading between $4.82 (+185%) and $13.74 (+715%), assuming another strong crypto bull market and continued investor interest in meme assets.
Telegaon projects even stronger long-term performance. Its estimates place TRUMP between $8.69 (+415%) and $10.18 (+500%) in 2028, followed by $10.42 (+515%) to $16.86 (+900%) in 2029. These forecasts assume TRUMP remains one of the leading political meme coins throughout the next market cycle.
TRUMP Coin Price Prediction 2030
DigitalCoinPrice forecasts OFFICIAL TRUMP between $2.50 (+50%) and $4.00 (+135%) by 2030. Its long-term outlook suggests moderate appreciation, with the token maintaining relevance but experiencing fewer explosive rallies than in previous years.
PricePrediction.net expects much stronger upside potential. According to its model, TRUMP could trade between $4.98 (+195%) and $12.35 (+630%) by 2030 if the project survives multiple market cycles and continues attracting speculative capital.
Telegaon remains the most optimistic forecaster. It estimates TRUMP could reach between $17.05 (+910%) and $22.25 (+1,220%) by the end of the decade, driven by sustained meme coin popularity, retail participation, and favorable crypto market conditions.
Should You Buy TRUMP Coin in 2026?
Whether TRUMP is worth buying in 2026 depends largely on your investment goals and risk tolerance. It is not a traditional cryptocurrency with a well-developed ecosystem or real-world utility. Instead, its value comes primarily from market sentiment, community engagement, and Donald Trump’s public profile. That makes TRUMP much more speculative than projects such as Bitcoin, Ethereum, or Solana.
The token has already proven that it can generate extraordinary returns during periods of strong demand. However, it has also shown how quickly those gains can disappear. After reaching an all-time high of $73.43, TRUMP lost more than 97% of its value. This history highlights both its upside potential and its extreme volatility.
Despite the decline, TRUMP remains one of the largest meme coins by market capitalization and continues to record healthy trading volume. It also benefits from a globally recognized brand, an active community, and regular media attention. These factors could help support future rallies, especially if the broader crypto market enters another bull cycle.
For most investors, TRUMP should be viewed as a high-risk, high-reward speculative asset, not a core portfolio holding. If you decide to invest, it is generally wiser to allocate only a small percentage of your crypto portfolio and avoid investing money you cannot afford to lose.
Bullish Case for TRUMP
Several catalysts could support TRUMP over the coming years. The 2026 U.S. midterm elections may increase media coverage surrounding Donald Trump and his political movement, potentially bringing fresh attention to the token. Historically, political headlines have often translated into higher trading activity.
Another positive factor is the possibility of additional exchange listings. Although TRUMP is already available on several leading platforms, a listing on exchanges that do not yet support the token could improve liquidity and attract new investors.
TRUMP would also benefit from a broader meme coin market recovery. During strong crypto bull markets, speculative assets often outperform large-cap cryptocurrencies as retail investors search for higher returns. In addition, TRUMP still has one of the largest communities among political meme coins, giving it strong brand recognition and consistent visibility across social media.
Bearish Risks to Consider
The biggest challenge for TRUMP remains its ongoing token unlock schedule. As additional tokens enter circulation, early investors and affiliated entities may choose to sell, increasing supply and creating downward pressure on the price.
Another concern is the project’s limited utility. Unlike many blockchain platforms, TRUMP does not currently offer a large ecosystem of decentralized applications or generate demand through network usage. Its value depends primarily on speculation and public interest.
Investors should also remember that TRUMP still trades about 97% below its all-time high. While this leaves room for recovery, it also demonstrates how quickly sentiment can change. Regulatory developments, political controversies, or declining public interest in Donald Trump could negatively affect the token. Because its performance is closely tied to one public figure, TRUMP carries a level of concentration risk that most major cryptocurrencies do not face.
How to Buy or Exchange TRUMP Coin
You can buy OFFICIAL TRUMP (TRUMP) on major centralized cryptocurrency exchanges that support the token. If you prefer not to create an account or complete KYC verification, you can also use a crypto swap service such as StealthEX. The platform supports more than 2,000 cryptocurrencies and allows direct wallet-to-wallet exchanges.
Buying TRUMP with StealthEX is simple:
- Select the exchange pair (for example, ETH → TRUMP) and enter the amount.
- Click Start Exchange.
- Enter your TRUMP wallet address.
- Send your crypto to the provided deposit address.
- Receive TRUMP directly in your wallet within minutes.

Frequently Asked Questions
What Is TRUMP Coin And Is It Worth Anything?
Yes. OFFICIAL TRUMP is a meme coin built on the Solana blockchain that launched in January 2025. Although it trades around 97% below its all-time high, it still has a market capitalization of approximately $400 million, making it one of the largest political meme coins. The token remains actively traded on major exchanges and continues to attract attention because of its connection to Donald Trump. However, its value depends largely on market sentiment rather than utility, making it a highly speculative cryptocurrency.
What Is the TRUMP Coin Price Prediction for 2026?
Forecasts for 2026 vary widely. DigitalCoinPrice expects $1.65–$2.95, PricePrediction.net projects $1.24–$6.2, while Telegaon forecasts $2.69–$5.63. A reasonable average target sits around $3.38 if market conditions improve.
Will TRUMP Coin Ever Go Back Up?
Yes, it could recover if the crypto market enters another bull cycle, meme coins regain popularity, and political events increase investor interest. However, there is no guarantee that TRUMP will revisit its previous all-time high.
How High Can TRUMP Coin Go?
Long-term forecasts differ significantly. Conservative models expect prices below $4 by 2030, while the most bullish prediction from Telegaon suggests TRUMP could reach $22.25 under favorable market conditions.
Is TRUMP Coin a Good Investment?
TRUMP may suit investors seeking high-risk, high-reward opportunities. It offers strong upside potential but remains extremely volatile and depends heavily on market sentiment, political developments, and continued community interest.
What Is the Difference Between TRUMP Coin and Trump NFTs?
TRUMP Coin is a cryptocurrency on the Solana blockchain that investors can trade on crypto exchanges. Trump Digital Trading Cards are NFTs issued on Polygon and function as digital collectibles rather than currencies. Their value depends on rarity and collector demand.
Follow us on Medium, X, Telegram, YouTube, and Publish0x to stay updated about the latest news on StealthEX.io and the rest of the crypto world.
Don’t forget to do your own research before buying any crypto. The views and opinions expressed in this article are solely those of the author.
*Prices for NFTs and physical collectibles change frequently, so investors should always check current marketplace listings before making a purchase.
crypto price prediction Donald Trump OFFICIAL TRUMP price analysis TrumpThe post TRUMP Coin Price Prediction 2026–2030: How High Can It Go and Is It Worth Buying? first appeared on StealthEX.]]>
In this guide, we explore realistic Terra Classic price predictions for 2026, 2027, 2028, and 2030. We also examine the factors that influence LUNC’s price, including token burns, community initiatives, market sentiment, and ecosystem development. Most importantly, we analyze whether a $1 valuation is mathematically possible given the current supply.
While Terra Classic still benefits from a dedicated community and ongoing burn programs, investors should understand both the opportunities and the significant risks before making any investment decisions. Read on to discover what could drive LUNC higher in the coming years and what challenges may stand in the way of a major recovery.
| Current LUNC Price | LUNC Price Prediction 2026 | LUNC Price Prediction 2030 |
| $0.000061 | $0.000275 | $0.025 |

What Is Terra Classic (LUNC)?
Terra Classic (LUNC) is the original version of the Terra blockchain, a cryptocurrency network that once ranked among the largest projects in the digital asset market. The platform aimed to create a payment ecosystem powered by algorithmic stablecoins, with TerraUSD (UST) serving as its flagship product.
Everything changed in May 2022 when UST lost its peg to the US dollar. The stablecoin was designed to maintain a value of $1 through a relationship with LUNA, the network’s native token. However, intense selling pressure triggered a collapse that wiped out billions of dollars in market value within days. As investors rushed to exit the ecosystem, the supply of LUNA exploded, causing its price to crash almost to zero.
Following the crisis, the Terra community approved a blockchain fork. The newly created chain became Terra 2.0, while the original network continued operating under the name Terra Classic. At the same time, the original LUNA token was renamed Terra LUNA Classic (LUNC).
Today, Terra Classic operates as a community-driven blockchain. Independent validators, developers, and token holders manage the network through decentralized governance. The community focuses on reducing the massive token supply through burn initiatives, improving network functionality, and rebuilding confidence in the ecosystem. Although Terra Classic no longer holds the dominant position it once enjoyed, it remains one of the most actively discussed recovery projects in the cryptocurrency market.

CoinGecko, June 24, 2026
Factors Influencing Terra Classic Price
Several factors influence the price of Terra Classic (LUNC). Unlike many established cryptocurrencies, LUNC’s future depends heavily on community activity, token supply reduction, and overall market confidence. Because the project experienced a historic collapse in 2022, investors closely monitor every development that could affect its recovery potential.
The most important factors include:
- Token burns, which permanently remove LUNC from circulation and reduce the overall supply.
- Community governance decisions, including proposals related to development, staking, and network improvements.
- Ecosystem growth, such as new applications, partnerships, and increased blockchain activity.
- Cryptocurrency market conditions, especially Bitcoin’s performance and overall investor sentiment.
Token Burning Strategy
The token burn strategy remains one of the most important elements of the Terra Classic recovery plan. A token burn permanently removes coins from circulation, reducing the total supply over time. The LUNC community introduced a tax burn mechanism that destroys a small percentage of certain on-chain transactions. In addition, several exchanges have supported off-chain burns by allocating part of their trading fees to burn programs.
Today, more than 450 billion LUNC tokens have been burned, although the circulating supply still remains above 6,4 trillion coins. This highlights the scale of the challenge facing the project.
While burns can help create scarcity and improve market sentiment, they are unlikely to produce dramatic price increases on their own. For meaningful appreciation, Terra Classic also needs stronger ecosystem growth, higher network activity, and sustained investor demand alongside continued supply reduction efforts.
Community Support and Market Sentiment
Unlike many blockchain projects, Terra Classic survives largely because of its dedicated community. Following the 2022 collapse, developers, validators, and token holders continued working on the network through a decentralized governance system. Community members regularly vote on proposals that influence development priorities, staking policies, and burn initiatives.
Social media platforms such as X, Reddit, Telegram, and Discord play a major role in maintaining engagement. News about burns, exchange support, and ecosystem upgrades often generates significant discussion and trading activity.
Community-driven momentum has helped keep Terra Classic relevant years after the collapse. However, market sentiment can change quickly, especially during periods of broader cryptocurrency weakness. Grassroots support provides an important foundation, but long-term success will depend on whether the community can attract new users, developers, and real blockchain activity rather than relying solely on speculation and social media enthusiasm.
| Year | Minimum Price | Maximum Price | Average Price | Price Change* |
| 2026 | $0.00005 | $0.0005 | $0.000275 | +350% |
| 2027 | $0.00006 | $0.0015 | $0.00078 | +1,180% |
| 2028 | $0.000055 | $0.0015 | $0.00077 | +1,160% |
| 2030 | $0.0001 | $0.05 | $0.025 | +41,000% |
LUNC Coin Price Prediction 2026
The outlook for Terra Classic in 2026 remains highly dependent on token burns, community activity, and overall cryptocurrency market conditions. Forecasts from DigitalCoinPrice and PricePrediction suggest that LUNC could experience moderate growth if the project continues reducing supply and maintaining investor interest.
Conservative Scenario ($0.00006-$0.0001)
This scenario closely follows the DigitalCoinPrice forecast, which projects LUNC trading between approximately $0.00006 and $0.0001 throughout 2026. In this case, burn programs continue, but ecosystem growth remains limited and market demand stays relatively weak.
Moderate Scenario ($0.0001-$0.00017)
A stronger crypto market and continued exchange-supported burns could push LUNC toward the middle of the PricePrediction range. Investors would likely reward consistent supply reduction and improved network activity.
Optimistic Scenario ($0.0002-$0.00026)
PricePrediction’s most bullish 2026 forecasts reach approximately $0.00026. This scenario would require major burn milestones, rising trading volumes, and a favorable market environment. While possible, it would likely require significantly stronger demand than the project currently experiences.
Overall, the moderate scenario appears the most realistic, while the optimistic scenario depends heavily on the successful execution of the community’s long-term recovery strategy.
Terra Classic Price Prediction 2027-2028
The years 2027 and 2028 will be critical for Terra Classic. By this stage, investors will expect tangible results from years of token burns and network rebuilding efforts.
2027 Conservative Scenario ($0.00006-$0.00012)
DigitalCoinPrice projects LUNC mostly between $0.00006 and $0.00013 during 2027. This scenario assumes modest ecosystem activity, gradual burns, and limited adoption growth.
2027 Moderate Scenario ($0.00012-$0.00023)
PricePrediction forecasts values ranging from roughly $0.0001 to $0.00023. Continued community engagement, improving sentiment, and steady supply reduction could support this outcome.
2027 Optimistic Scenario ($0.00023-$0.0003)
For LUNC to move beyond existing forecasts, the project would need accelerated burns, stronger exchange participation, and a broader crypto bull market. Such a move would require demand growth that exceeds current expectations.
Looking ahead to 2028, PricePrediction forecasts a potential range between $0.00009 and $0.00025, while DigitalCoinPrice remains more conservative at approximately $0.00005 to $0.00009.
The difference highlights uncertainty surrounding long-term adoption. If cumulative burns remove a meaningful percentage of supply and market conditions remain favorable, LUNC could gradually trend toward the higher end of these projections. However, supply reduction alone will not be enough without sustained ecosystem development.
LUNC Price Prediction 2030
By 2030, Terra Classic’s success will depend on whether it can remain relevant in an increasingly competitive blockchain industry. The project will need both substantial supply reduction and genuine utility growth to justify significantly higher valuations.
DigitalCoinPrice forecasts LUNC between approximately $0.0001 and $0.00015 by 2030. This represents a relatively conservative outlook that assumes steady but limited progress.
Conservative Scenario ($0.0001-$0.00015)
This scenario reflects the DigitalCoinPrice forecast and assumes gradual burns, stable community support, and modest ecosystem activity.
Moderate Scenario ($0.0002-$0.0005)
PricePrediction projects a range of roughly $0.00021 to $0.0005. This outcome would require continued burn initiatives, stronger investor confidence, and sustained growth across the broader cryptocurrency market.
Optimistic Scenario ($0.0005-$0.001)
A move beyond current forecasts would require extraordinary progress. Supply would need to decline significantly, network activity would need to expand, and Terra Classic would need to compete successfully against established smart-contract ecosystems.
Even by 2030, the circulating supply is likely to remain the biggest obstacle. While meaningful gains remain possible, long-term appreciation will depend on balancing aggressive supply reduction with real-world adoption and utility growth.
Will Terra Classic LUNC Reach $1?
Many investors continue to ask whether Terra Classic can eventually reach $1. While the idea is appealing, the numbers tell a very different story.
LUNC currently has a circulating supply of roughly 6.5 trillion tokens. If each token were worth $1, Terra Classic would have a market capitalization of approximately $6.5 trillion. For comparison, that would be significantly larger than the market value of most publicly traded companies and several times larger than the entire cryptocurrency market today.
To make a $1 price remotely realistic, the circulating supply would need to fall dramatically. Even after hundreds of billions of tokens have been burned, the supply remains measured in trillions. Most estimates suggest that more than 99.9% of the current supply would need to disappear before a $1 valuation becomes mathematically plausible.
As a result, the overwhelming consensus among analysts is that LUNC reaching $1 is effectively impossible under current conditions. Smaller price increases remain possible, but a $1 target would require an unprecedented supply reduction and extraordinary demand growth.
Is Terra Classic (LUNC) a Good Investment?
Terra Classic may appeal to investors who are comfortable taking significant risks in pursuit of potentially high returns. The project still has an active community and ongoing burn programs, but it also faces serious challenges related to supply, competition, and long-term adoption.
For long-term investors seeking stability and predictable growth, stronger blockchain projects may offer a better risk-to-reward profile. However, short-term traders and speculative investors may find opportunities during periods of increased market interest.
Overall, LUNC should be treated as a high-risk speculation rather than a core portfolio holding. Most investors should consider limiting exposure to 1-3% of their total cryptocurrency portfolio to manage risk effectively.
How to Buy Terra Classic (LUNC)
Buying Terra Classic (LUNC) is relatively straightforward, even for beginners. The token is available on several major cryptocurrency exchanges, including Binance, KuCoin, and Kraken. However, if you want to exchange crypto without creating an account, StealthEX offers a simple wallet-to-wallet solution.
Follow these steps to buy LUNC through StealthEX:
Step 1: Visit StealthEX and select the cryptocurrency pair you want to exchange, such as ETH to LUNC
Step 2: Enter the amount you want to swap. The platform will automatically calculate how much LUNC you are expected to receive.
Step 3: Click the exchange button and enter your Terra Classic wallet address. Always double-check the address before proceeding.
Step 4: Send your cryptocurrency to the deposit address generated by StealthEX. Make sure you send the correct asset on the correct blockchain network.
Step 5: Wait for the transaction to be confirmed. Once the exchange is completed, your LUNC coins will arrive directly in your wallet.
For long-term storage, many investors use Terra Station, Trust Wallet, or a Ledger hardware wallet. Hardware wallets generally provide the highest level of security because they keep private keys offline and away from potential online threats.

Frequently Asked Questions
Will LUNC Ever Recover?
LUNC may recover part of its value if token burns continue and the community remains active. However, a return to its all-time high near $119 is effectively impossible due to the massive increase in circulating supply after the 2022 collapse.
What Is the LUNC Price Prediction for 2040 and 2050?
Long-term forecasts vary widely. Most optimistic projections suggest LUNC could reach fractions of a cent by 2040 or 2050. However, predictions become increasingly unreliable over such long timeframes and depend heavily on supply reduction.
Can the Burn Mechanism Push LUNC to $1?
The burn mechanism alone is unlikely to push LUNC to $1. Reaching that level would require more than 99.9% of the current supply to be removed while demand grows dramatically. Most analysts consider this scenario unrealistic.
What Is the Current Circulating Supply of LUNC?
Terra Classic currently has a circulating supply of approximately 6.5 trillion tokens. Although hundreds of billions of coins have been burned, the remaining supply is still extremely large compared to most major cryptocurrencies.
Does LUNC Have a Future?
LUNC still has an active community, ongoing development efforts, and regular burn initiatives. While the project faces significant challenges, it may continue operating as a speculative community-driven blockchain with limited but meaningful growth potential.
Follow us on Medium, X, Telegram, YouTube, and Publish0x to get StealthEX.io updates and the latest news about the crypto world.
Don’t forget to do your own research before buying any crypto. The views and opinions expressed here are solely those of the author.
LUNA LUNC price prediction Terra Terra ClassicThe post Will LUNC Reach $1? Terra Classic Price Prediction & Market Reality first appeared on StealthEX.]]>

CoinGecko, June 24, 2026
In this Hedera HBAR price prediction guide, we explore potential price scenarios for 2026, 2027, and 2030. We examine both bullish and bearish outcomes, while also considering more balanced forecasts based on realistic market conditions. Although no prediction can guarantee future performance, analyzing possible scenarios can help investors make more informed decisions. Read on to discover the key factors that could influence HBAR’s long-term value and what analysts may expect from this ambitious blockchain alternative.
| Current HBAR Price | HBAR Price Prediction 2026 | HBAR Price Prediction 2030 |
| $0.075 | $0.18 | $0.31 |

Introduction to Hedera (HBAR) and Current Market Overview
Hedera (HBAR) is currently trading around $0.075 per token, with a market capitalization close to $3.3 billion and a daily trading volume ranging between $50 million and $100 million. These figures place HBAR among the top 30 cryptocurrencies by market value. The network has approximately 43.5 billion HBAR in circulation out of a fixed maximum supply of 50 billion tokens.
| Metric | Current Value |
| HBAR Price | ~$0.075 |
| Market Cap | ~$3.3B |
| 24H Volume | $50M-$100M |
| Circulating Supply | ~43,473,263,318 HBAR |
| Total Supply | 50,000,000,000 HBAR |
| Market Cap Rank | Top 25 |
Despite remaining far below its 2021 all-time high of $0.57, HBAR continues to attract attention because of its strong enterprise focus and growing ecosystem. Investors follow Hedera closely since its long-term success depends on real-world adoption by businesses, governments, and developers.
What Is Hedera (HBAR)? Understanding the Fundamentals
Hedera is a public distributed ledger network that uses a technology called Hashgraph instead of a traditional blockchain. While most cryptocurrencies process transactions by adding blocks to a chain, Hedera uses a different structure that allows the network to reach consensus faster and more efficiently.
One of Hedera’s key innovations is its asynchronous Byzantine Fault Tolerance (aBFT) security model. This mechanism helps the network remain secure even if some participants act maliciously or experience technical failures. As a result, Hedera delivers high performance while maintaining strong security standards.
The network can process more than 10,000 transactions per second (TPS) and usually reaches transaction finality in 3 to 5 seconds. These capabilities make it suitable for payments, tokenization, supply chain solutions, gaming, and enterprise applications.
HBAR serves several important functions within the ecosystem. Users pay transaction fees with HBAR, developers use it to power smart contracts, and token holders can stake their coins to help secure the network and earn rewards. Hedera is also governed by a council of major global organizations, which helps support network development and long-term stability.
Factors Influencing HBAR Price
Several factors can influence the HBAR price between 2026 and 2030. The most important one is real network adoption. Hedera already processes large transaction volumes, and recent public data shows more than 71 billion total transactions on the network. However, daily activity can change quickly, so investors should track real TPS, total transactions, DeFi volume, and active dApps instead of relying on old peak numbers.
Hedera’s roadmap also matters. Current development focuses on better EVM compatibility, sponsored fees, Hiero Hooks, TSS signatures, Block Nodes, state proofs, and Block Streams. These upgrades can make Hedera easier to use for developers, enterprises, and applications that need reliable audit trails. If these upgrades increase real usage, HBAR demand may improve over time.
Tokenomics also play a major role. HBAR has a fixed total supply of 50 billion tokens. Hedera’s treasury report shows that most tokens have already entered released supply, with the adjusted released supply forecasted at about 94.56% by Q2 2026. This means the supply overhang should become smaller after 2026, although future treasury releases can still affect market pressure.
Hedera also competes with major Layer 1 networks. Its main advantage is predictable fees, enterprise governance, and fast settlement. Its main weakness is smaller DeFi liquidity and fewer dApps compared with Ethereum and Solana.
| Network | Main Strength | Main Weakness |
| Hedera | Fast finality, low predictable fees, enterprise focus | Smaller retail and DeFi ecosystem |
| Ethereum | Largest developer and DeFi ecosystem | Higher fees on mainnet |
| Solana | Strong speed, liquidity, and retail traction | History of network reliability concerns |
| Cardano | Research-driven design and loyal community | Slower ecosystem growth |
Market cycles also matter. Like most altcoins, HBAR often follows Bitcoin during major risk-on and risk-off phases. When Bitcoin rises and liquidity returns to crypto, utility altcoins can attract more capital. However, when Bitcoin falls, HBAR can also drop sharply, even if Hedera’s fundamentals continue to improve.
HBAR Price Prediction 2026, 2027-2030
| Year | Minimum Price | Maximum Price | Average Price | Price Change |
| 2026 | $0.0708 | $0.2964 | $0.1836 | +145% |
| 2027 | $0.0822 | $0.2095 | $0.1458 | +95% |
| 2030 | $0.0981 | $0.5249 | $0.3115 | +635% |
HBAR Price Prediction 2026
HBAR price predictions for 2026 show a wide gap between conservative and bullish models. According to DigitalCoinPrice, Hedera may trade in a relatively narrow range between $0.0711 and $0.0984 during the second half of 2026. This forecast suggests limited upside and a slow recovery pattern rather than a strong breakout.
PricePrediction.net gives a much more optimistic outlook. Its 2026 forecast places HBAR between $0.0708 and $0.2964, with the highest projected value appearing in December. This model assumes stronger market momentum, better investor sentiment, and higher demand for utility-focused altcoins.
| Source | 2026 Minimum Price | 2026 Maximum Price | General Outlook |
| DigitalCoinPrice | $0.0711 | $0.0984 | Conservative |
| PricePrediction.net | $0.0708 | $0.2964 | Bullish |
A balanced 2026 scenario sits between these two forecasts. If Hedera grows steadily but avoids a major speculative rally, HBAR could trade around the $0.1–$0.18 range. However, if the broader crypto market enters a strong bull phase, HBAR may attempt to move closer to the higher PricePrediction.net targets.
HBAR Price Prediction 2027
Forecasts for 2027 suggest that Hedera could enter a consolidation phase after any potential gains achieved in 2026. DigitalCoinPrice remains relatively conservative, projecting HBAR between $0.0866 and $0.10 throughout the year. This outlook implies stable network growth but limited speculative interest, keeping prices close to current levels.
PricePrediction.net presents a more optimistic scenario. Its projections place HBAR between $0.0822 and $0.2095 during 2027, with the strongest prices expected early in the year. While this model still anticipates periods of weakness, it suggests that Hedera could maintain significantly higher valuations if enterprise adoption and ecosystem activity continue to expand.
| Source | 2027 Minimum Price | 2027 Maximum Price | General Outlook |
| DigitalCoinPrice | $0.0866 | $0.1 | Conservative |
| PricePrediction.net | $0.0822 | $0.2095 | Moderate Bullish |
A realistic middle-ground scenario places HBAR between $0.09 and $0.15 for most of 2027. This range would reflect gradual adoption growth, increasing transaction activity, and a more mature crypto market environment. However, if institutional interest accelerates and Hedera secures additional enterprise partnerships, HBAR could challenge the upper PricePrediction.net targets near $0.2. Conversely, weaker market sentiment could keep the token trading closer to the conservative DigitalCoinPrice estimates.
HBAR Price Prediction 2030
The 2030 Hedera price prediction shows an even stronger difference between the two sources. DigitalCoinPrice remains cautious and expects HBAR to trade between $0.0981 and $0.12 in 2030. This forecast suggests that Hedera may grow slowly, even if the project continues to develop its enterprise ecosystem.
PricePrediction.net presents a far more bullish long-term view. Its 2030 forecast places HBAR between $0.2302 and $0.5249. The highest estimate appears in January 2030, while the forecast trends lower toward the end of the year. Even so, this model still suggests much higher upside than DigitalCoinPrice.
| Source | 2030 Minimum Price | 2030 Maximum Price | General Outlook |
| DigitalCoinPrice | $0.0981 | $0.12 | Conservative |
| PricePrediction.net | $0.2302 | $0.5249 | Bullish |
A realistic 2030 scenario may sit near the middle of these projections. If Hedera expands its enterprise use cases, keeps developer activity alive, and benefits from stronger crypto market cycles, HBAR could move toward $0.2–$0.35. However, if adoption remains slow or the altcoin market weakens, the price may stay closer to the DigitalCoinPrice range.
Investment Risks and Considerations
HBAR offers significant upside potential, but investors should understand the risks before investing. Like most cryptocurrencies, Hedera has experienced extreme volatility throughout its history. During previous crypto bear markets, many major altcoins, including HBAR, suffered 50% to 80% drawdowns from their cycle highs.
Although Hedera has maintained a strong security record, technology risks still exist. Software bugs, unexpected network issues, or vulnerabilities in smart contracts could affect user confidence and adoption. Regulatory uncertainty also remains a concern. Future SEC enforcement actions or a potential classification of certain crypto assets as securities could impact market sentiment and exchange availability.
Competition presents another challenge. If Ethereum scaling solutions continue improving and attracting developers, Hedera may struggle to expand its market share. For risk management, many investors limit HBAR exposure to roughly 5% to 15% of their total crypto portfolio, helping balance potential rewards with the risks associated with a single blockchain project.
How to Buy HBAR: Step-by-Step Guide with StealthEX
HBAR is available on many major cryptocurrency exchanges, including Binance, Coinbase, Kraken, KuCoin, and Bitfinex. These platforms allow users to buy Hedera using bank transfers, debit cards, credit cards, or other cryptocurrencies. However, most centralized exchanges require account registration and identity verification before trading.
Another popular option is StealthEX. The platform allows users to exchange cryptocurrencies directly from one wallet to another without creating an account. StealthEX supports more than 2,000 digital assets, offers competitive exchange rates, and usually completes transactions within minutes.
Step 1: Visit StealthEX.io and select the cryptocurrency you want to exchange. Then choose HBAR as the coin you want to receive.
Step 2: Enter the amount you would like to swap.
Step 3: Provide your Hedera wallet address.
Step 4: Review the exchange details and click the confirmation button.
Step 5: Send the requested cryptocurrency to the deposit address generated by StealthEX and wait for the transaction to be processed to receive HBAR directly in your wallet.

Before purchasing HBAR, it is important to choose a secure crypto wallet. Popular Hedera wallets include HashPack and Blade Wallet, both of which offer full support for the Hedera ecosystem. Long-term investors often prefer hardware wallets such as Ledger, which provide an additional layer of security by storing private keys offline. Regardless of the wallet you choose, always back up your recovery phrase and never share it with anyone.
Frequently Asked Questions About HBAR Price Predictions
Will HBAR Reach $1?
HBAR reaching $1 is possible, but it would require significantly higher adoption, stronger market conditions, and a much larger market capitalization. Most realistic forecasts place this target in a long-term bullish scenario rather than the near future.
Can HBAR Reach $5 By the End of the Market Cycle?
A $5 HBAR price would imply a market capitalization of roughly $250 billion based on the fixed supply of 50 billion tokens. While not impossible, the probability appears very low for the current market cycle. A more realistic cycle peak could fall within the $0.5-$1.5 range.
Will HBAR Reach $10 or Is It Realistic?
HBAR at $10 would require a market capitalization of approximately $500 billion, placing it near the largest crypto assets in history. Such a valuation would require extraordinary adoption and market dominance, making it unlikely in the foreseeable future.
Can HBAR Reach $100, or Is It Mathematically Impossible?
HBAR reaching $100 is not mathematically impossible, but it would require a market capitalization of around $5 trillion. This exceeds the size of most realistic crypto market forecasts and should not be considered a practical investment scenario.
How High Can HBAR Realistically Go?
A realistic long-term outlook depends on adoption and market conditions. Near-term targets may range from $0.15 to $0.4, while successful execution over several years could potentially support prices between $0.8 and $2.
What Is the Hedera (HBAR) Price Prediction for the Next Bull Run?
If crypto market sentiment improves and capital flows back into utility-focused altcoins, HBAR could potentially trade between $0.4 and $1.2 during a strong bull market. However, results will depend heavily on Bitcoin and overall liquidity.
What Are the Expert Hedera Price Forecasts for 2035 and 2040?
Long-term forecasts carry substantial uncertainty. If Hedera continues expanding its ecosystem and enterprise adoption, some speculative scenarios suggest a potential range of $1-$2.5 by 2035 and $3-$10 by 2040.
When Will HBAR Explode or See Its Next Major Rally?
Predicting exact timing is impossible. Historically, major HBAR rallies have followed broader crypto bull markets, major enterprise partnerships, ecosystem growth, and increased investor interest across the altcoin sector.
Is HBAR a Good Investment?
HBAR may appeal to investors seeking exposure to enterprise blockchain technology. However, it remains a high-risk asset. Investors should conduct their own research and only allocate capital they can afford to lose.
Follow us on Medium, X, Telegram, YouTube, and Publish0x to stay updated about the latest news on StealthEX.io and the rest of the crypto world.
Don’t forget to do your own research before buying any crypto. The views and opinions expressed in this article are solely those of the author.
crypto price prediction HBAR Hedera Hashgraph price analysis price predictionThe post Hedera HBAR Price Prediction 2026, 2027, 2030: Long Forecast first appeared on StealthEX.]]>
At the time of writing, Aerodrome Finance trades at around $0.44. During the past month, the token reached a low of $0.3 on June 6 before recovering and climbing to a monthly high of $0.51 on June 18. This strong rebound highlights how quickly market sentiment can change and why investors should always combine technical analysis with fundamental research before making any decision.

CoinGecko, June 18, 2026
In this guide, you will find detailed AERO price predictions for the short, medium, and long term. We will also explain technical indicators, key support and resistance levels, moving averages, market correlations, and the factors that could influence future price movements. Finally, we will answer the most common questions beginners ask and show you how to buy Aerodrome Finance in a simple step-by-step process. So, let’s get started!
| Current AERO Price | AERO Price Prediction 2026 | AERO Price Prediction 2030 |
| $0.44 | $1 | $5 |
Short-Term Aerodrome Finance Price Targets
Short-term Aerodrome Finance price predictions suggest that AERO could remain volatile throughout the rest of 2026, although most analysts expect the token to benefit if the broader crypto market stays bullish. Forecasts from DigitalCoinPrice and PricePrediction.net present different scenarios, which highlights the uncertainty that surrounds short-term price movements.
Looking at the next month, DigitalCoinPrice expects AERO to trade between $0.4 and $0.41, with an average price close to $0.41, indicating a period of consolidation after recent fluctuations. PricePrediction.net is slightly more optimistic, forecasting a range between $0.32 and $0.46, with an average of $0.39. Together, these estimates suggest that Aerodrome Finance could remain close to its current valuation while waiting for a stronger market catalyst.
The six-month outlook paints a more bullish picture. By December 2026, DigitalCoinPrice projects AERO around $0.4, implying relatively stable performance with limited upside. In contrast, PricePrediction.net expects a much stronger recovery, forecasting a minimum price of $0.86, an average of $1.04, and a potential high of $1.23. This scenario assumes growing adoption of the Base ecosystem and stronger investor demand for decentralized finance protocols.
At the end of 2026, the gap between forecasts remains significant. DigitalCoinPrice believes Aerodrome Finance could finish the year around $0.4, while PricePrediction.net estimates that the token may close between $0.86 and $1.23.

Long-Term Aerodrome Finance Prediction (2026-2050)
| Year | Minimum Price | Maximum Price | Average Price | Price Change |
| 2026 | $0.32 | $2.19 | $1 | +125% |
| 2027 | $0.33 | $3.53 | $2 | +355% |
| 2030 | $0.65 | $10.73 | $5 | +1,050% |
| 2040 | $1.27 | $51.86 | $25 | +5,500% |
| 2050 | $2.15 | $2.38 | $2.2 | +400% |
Aerodrome Finance Price Prediction 2026
DigitalCoinPrice estimate that Aerodrome Finance (AERO) could trade between $0.38 (+12%) and $0.52 (+20%) in 2026. Their forecast suggests a period of consolidation, with moderate upside supported by continued growth of the Base ecosystem and increasing DeFi adoption.
According to PricePrediction, AERO could experience stronger momentum. Their models project a minimum price of $0.32 (-25%) and a maximum of $1.23 (+185%), indicating that improving market sentiment could push the token significantly above its current valuation.
Telegaon presents the most optimistic scenario for 2026. Its forecast places AERO between $0.85 (+90%) and $2.19 (+410%), assuming rapid ecosystem expansion, higher trading volumes, and broader adoption of decentralized finance protocols.
Aerodrome Finance Price Prediction 2027
DigitalCoinPrice expects AERO to strengthen in 2027, forecasting a trading range between $0.33 (-25%) and $0.56 (+30%). The projection reflects gradual protocol growth and a more mature liquidity ecosystem.
PricePrediction offers a slightly more bullish outlook, estimating a minimum price of $0.42 (-2%) and a maximum of $1.12 (+160%). These estimates suggest that Aerodrome Finance could benefit from renewed investor confidence during the next market cycle.
Telegaon remains highly optimistic, forecasting a price range between $2.24 (+420%) and $3.53 (+720%). This scenario assumes substantial user adoption and continued expansion of the Base blockchain ecosystem.
Aerodrome Finance Price Prediction 2030
By 2030, DigitalCoinPrice expects AERO to trade between $0.65 (+50%) and $1 (+130%), supported by broader DeFi adoption and continued protocol development.
PricePrediction sees considerably stronger upside potential. Its models forecast a minimum price of $1.02 (+135%) and a maximum of $2.45 (+470%), assuming Aerodrome Finance establishes itself as one of the leading decentralized exchanges on Base.
Telegaon’s long-term outlook is significantly more bullish. According to its estimates, AERO could range from $7.86 (+1,730%) to $10.73 (+2,400%) by 2030, reflecting expectations of mass adoption and sustained ecosystem growth.
Aerodrome Finance Price Prediction 2040
DigitalCoinPrice projects that AERO could trade between $1.27 (+195%) and $1.45 (+235%) in 2040, representing steady long-term appreciation driven by continued blockchain adoption.
Telegaon offers a far more aggressive scenario, forecasting a price range between $36.18 (+8,300%) and $51.86 (+11,950%). Such projections assume widespread institutional adoption, a mature DeFi sector, and significant long-term capital inflows into the crypto market.
Aerodrome Finance Price Prediction 2050
DigitalCoinPrice estimates that AERO could trade between $2.15 (+400%) and $2.38 (+450%) by 2050, reflecting gradual but sustained growth over the coming decades.
Aerodrome Finance Technical Analysis
According to monthly data from Investing.com, the overall technical outlook for Aerodrome Finance shows Sell signals.

Investing, June 18, 2026
The summary indicates that bearish momentum still dominates the market. Technical Indicators generate 5 sell signals and 0 buy signals, while Moving Averages produce 7 sell signals and 5 buy signals. Although several long-term averages remain supportive, the overall picture suggests that sellers currently have the advantage.
The RSI (14) stands at 42.4, which signals Sell and reflects weak momentum without reaching extreme oversold territory. Meanwhile, the MACD (12,26) remains neutral at 0, indicating that neither buyers nor sellers have established a clear trend. The ADX (14) reads 24.396, suggesting that the current trend lacks strong conviction.
Several oscillators point to oversold conditions. Stochastic (9,6) sits at 6.196, Williams %R stands at -91.338, and the Ultimate Oscillator reads 24.054. These values suggest that AERO may be approaching short-term exhaustion after recent selling pressure. However, oversold indicators alone do not guarantee a reversal, especially during broader market weakness.
Overall, the monthly technical structure remains cautious. Until momentum indicators and moving averages begin shifting toward Buy signals, Aerodrome Finance price predictions continue to favor a conservative short-term outlook.
Aerodrome Finance Key Price Levels
Pivot points help traders identify important support and resistance zones that may influence future price movements.
The main Classic Pivot Point stands at 0.5. This level acts as the market’s equilibrium point. If Aerodrome Finance trades below this area, bearish pressure could remain dominant. A sustained move above it would strengthen the bullish case.
Key support levels are:
- S1: 0.4
- S2: 0.4
- S3: 0.3
If AERO falls below the first support zone around $0.4, sellers could push the price toward the stronger support near $0.3.
Key resistance levels are:
- R1: 0.6
- R2: 0.6
- R3: 0.7
A breakout above $0.6 could improve market sentiment and open the door for another attempt toward $0.7.
Fibonacci and Woodie’s pivot levels confirm similar support and resistance zones, while Camarilla levels show heavy price clustering around $0.4-$0.5. These areas will likely remain the most important technical levels for traders in the coming weeks.
Popular Aerodrome Finance Moving Averages and Oscillators
The latest monthly data from Investing.com shows a mixed picture, although moving averages still lean toward a bearish trend.

Investing, June 18, 2026
Short-term moving averages show:
- MA5 Simple: 0.4 (Buy)
- MA5 Exponential: 0.4 (Buy)
- MA10 Simple: 0.6 (Sell)
- MA10 Exponential: 0.5 (Sell)
- MA20 Simple: 0.7 (Sell)
- MA20 Exponential: 0.6 (Sell)
Medium- and long-term averages remain divided:
- MA50 Simple: 0.4 (Buy)
- MA50 Exponential: 0.8 (Sell)
- MA100 Simple: 0.2 (Buy)
- MA100 Exponential: 0.9 (Sell)
- MA200 Simple: 0.1 (Buy)
- MA200 Exponential: 1 (Sell)
This combination suggests that historical long-term support remains intact, while shorter-term momentum continues to favor sellers.
Oscillators also reflect current market weakness:
- RSI (14): 42.4 (Sell)
- CCI (14): -69.581 (Sell)
- ROC: -28.534 (Sell)
- Bull/Bear Power: -0.3406 (Sell)
- Stochastic (9,6): 6.196 (Oversold)
- Williams %R: -91.338 (Oversold)
- Ultimate Oscillator: 24.054 (Oversold)
Finally, the ATR (14) stands at 0.2953, indicating relatively low volatility compared with major breakout periods. While several oscillators suggest that selling pressure may be fading, traders should wait for confirmation from momentum indicators and moving averages before expecting a sustained bullish reversal.
Correlation
Aerodrome Finance is highly correlated with the broader cryptocurrency market, especially Bitcoin and Ethereum. When major cryptocurrencies enter a bullish trend, liquidity usually flows into DeFi projects, which can support higher AERO prices.
At the same time, Aerodrome Finance has a particularly strong connection to the Base blockchain ecosystem. Growth in Base users, trading volume, and total value locked often benefits the protocol directly.
On the other hand, market-wide corrections, declining investor sentiment, or lower DeFi activity can put pressure on AERO. For this reason, investors should monitor both general crypto trends and Base ecosystem developments.
Is Aerodrome Finance a Good Investment?
Aerodrome Finance could be an interesting investment for people who believe in the long-term growth of decentralized finance and the Base blockchain ecosystem. The protocol has become one of the leading decentralized exchanges on Base, which gives it a strong position if adoption continues to increase.
However, AERO remains a volatile cryptocurrency, and its price can change rapidly during market cycles. As a result, it may suit investors with a higher risk tolerance who are willing to hold through periods of significant price fluctuations.
Will Aerodrome Finance Coin Go Up?
Many analysts believe Aerodrome Finance has room for future growth, although no prediction is guaranteed. The project’s expansion depends on factors such as user adoption, trading activity, liquidity growth, and the overall performance of the crypto market.
Forecasts from DigitalCoinPrice, PricePrediction, and Telegaon all suggest potential upside over the coming years, but they differ significantly in their targets. If the Base ecosystem continues to attract developers and users, AERO could benefit from increasing demand and stronger long-term market sentiment.
How High Can Aerodrome Finance Go?
The maximum price Aerodrome Finance can reach depends largely on adoption and overall crypto market conditions. Conservative forecasts expect AERO to gradually move above $1 over the next several years, while more optimistic models project significantly higher valuations if decentralized finance experiences another major expansion.
Some long-term forecasts even place the token above $10 under extremely bullish conditions. Although these projections illustrate the project’s potential, investors should remember that cryptocurrency markets remain unpredictable and future prices can differ substantially from current estimates.
Aerodrome Finance Price Prediction FAQ
What Is Aerodrome Finance’s Price Prediction Today?
Today’s Aerodrome Finance price prediction depends on short-term market sentiment, Bitcoin’s direction, and trading volume. Based on current technical indicators, AERO may continue trading around its recent range unless a strong catalyst triggers a breakout.
What Is the Aerodrome Finance Price Prediction for this Week?
Over the next week, AERO is expected to remain volatile while following broader crypto market trends. If buying momentum improves, the token could test higher resistance levels, while weak sentiment may lead to another retest of nearby support.
What Is the Aerodrome Finance Price Prediction for Next Week?
The outlook for next week remains neutral to slightly bearish according to current technical analysis. However, positive news from the Base ecosystem or a broader market recovery could quickly improve investor sentiment and support higher prices.
What Will the Price of Aerodrome Finance Be Next Month?
Short-term forecasts suggest Aerodrome Finance could trade between approximately $0.4 and $0.46 over the next month according to DigitalCoinPrice and PricePrediction estimates. Actual price action will depend on market conditions and investor demand.
What Is the Aerodrome Finance Price Prediction for 2026?
DigitalCoinPrice forecasts AERO between $0.38 and $0.52 in 2026. PricePrediction expects a wider range from $0.32 to $1.23, while Telegaon projects the most bullish scenario between $0.85 and $2.19.
What Is the Aerodrome Finance Price Prediction for 2027?
For 2027, DigitalCoinPrice estimates a range of $0.33 to $0.56. PricePrediction forecasts $0.42 to $1.12, whereas Telegaon expects significantly stronger growth with prices between $2.24 and $3.53.
What Is the Aerodrome Finance Price Prediction for 2030?
Long-term forecasts for 2030 remain optimistic. DigitalCoinPrice projects $0.65 to $1, PricePrediction estimates $1.02 to $2.45, and Telegaon expects AERO could trade between $7.86 and $10.73 under a highly bullish adoption scenario.
What Is the Aerodrome Finance Price Prediction for 2040?
DigitalCoinPrice expects Aerodrome Finance to trade between $1.27 and $1.45 by 2040. Telegaon presents a much more aggressive outlook, forecasting a range between $36.18 and $51.86 if decentralized finance achieves widespread global adoption.
Can AERO Reach $1?
Yes, reaching $1 appears realistic according to several forecasting models. DigitalCoinPrice expects AERO to approach this level by 2030, while PricePrediction suggests it could happen earlier if market conditions remain favorable.
Can AERO Reach $10?
A move to $10 would require substantial ecosystem growth and a strong crypto bull market. While conservative forecasts remain below this level, Telegaon’s long-term model projects that AERO could exceed $10 around 2030 under very bullish conditions.
Can AERO Reach $100?
Reaching $100 would require an enormous increase in market capitalization and widespread adoption across the decentralized finance sector. Based on current forecasts and market conditions, this target appears highly unlikely in the foreseeable future, although no long-term scenario can be completely ruled out.
How to Read and Predict Aerodrome Finance Price Movements?
Understanding Aerodrome Finance price movements requires a combination of technical analysis, market sentiment, and ecosystem fundamentals. Like most cryptocurrencies, AERO moves in cycles that include accumulation, expansion, correction, and consolidation. Identifying the current phase helps investors make more informed decisions instead of reacting emotionally to short-term volatility.
Traders should also monitor Bitcoin, as its price often influences the entire crypto market. By combining chart analysis with indicators and news about the Base ecosystem, investors can build more reliable Aerodrome Finance price predictions.
Aerodrome Finance Price Prediction Indicators
Technical indicators help traders evaluate trend strength, momentum, and possible reversal points. No single indicator guarantees accuracy, so they work best when used together.
Some of the most popular indicators include:
- RSI (Relative Strength Index) to identify overbought and oversold conditions.
- MACD to detect changes in market momentum.
- Moving Averages to determine the overall trend direction.
- Stochastic Oscillator to spot potential reversals.
- Volume to confirm whether breakouts have strong market participation.
- Support and Resistance Levels to identify likely buying and selling zones.
Using several indicators together provides a more balanced view of the market than relying on only one signal.
How to Read Aerodrome Finance Charts and Predict Price Movements?
Reading Aerodrome Finance charts starts with identifying the overall trend. Higher highs and higher lows usually indicate an uptrend, while lower highs and lower lows suggest a bearish market. Trendlines, moving averages, and support and resistance levels help traders recognize important turning points. Volume is equally important because strong price moves with increasing volume are generally more reliable. Candlestick formations can also reveal changes in market sentiment. By combining chart patterns with technical indicators and fundamental developments, investors can improve the quality of their AERO price predictions.
What Affects the Price of Aerodrome Finance?
The price of Aerodrome Finance changes because of both project-specific developments and broader cryptocurrency market conditions. Growth in the Base blockchain ecosystem can increase demand for AERO, while bearish market sentiment can quickly reduce investor interest. Liquidity, adoption, and macroeconomic events also influence price performance.
The main factors include:
- Growth of the Base blockchain ecosystem.
- Total value locked (TVL) on Aerodrome Finance.
- Trading volume and protocol activity.
- Bitcoin and Ethereum price movements.
- Overall crypto market sentiment.
- DeFi adoption and user growth.
- Regulatory developments.
- Token supply and distribution.
- Exchange listings and liquidity.
- Partnerships and ecosystem integrations.
These factors often work together and can significantly influence short-term and long-term price trends.
Bullish and Bearish Price Prediction Patterns
Chart patterns help traders identify potential trend continuations or reversals. While none of them guarantee future performance, they remain widely used by technical analysts.
Popular bullish patterns:
- Cup and Handle
- Ascending Triangle
- Inverse Head and Shoulders
- Double Bottom
- Triple Bottom
- Bull Flag
- Bull Pennant
- Falling Wedge
- Rounded Bottom
- Ascending Channel
- Golden Cross
- Breakout Above Resistance
Popular bearish patterns:
- Head and Shoulders
- Double Top
- Triple Top
- Descending Triangle
- Bear Flag
- Bear Pennant
- Rising Wedge
- Descending Channel
- Death Cross
- Breakdown Below Support
- Lower High Formation
- Distribution Range
How to Buy Aerodrome Finance: Quick-Step Guide
You can buy Aerodrome Finance (AERO) on major cryptocurrency exchanges, but if you prefer a faster and more private method, you can also swap crypto through StealthEX without creating an account.
StealthEX allows you to exchange more than 2,000 cryptocurrencies with direct wallet-to-wallet transfers, making the process simple and beginner-friendly.
Just follow these steps:
- Choose the crypto pair and enter the amount you want to exchange (for example, ETH to AERO).
- Click the “Start Exchange” button.
- Enter your Aerodrome Finance wallet address.
- Send your funds to the deposit address provided by StealthEX.
- Wait for the transaction to be processed.
- Receive AERO directly in your wallet.
That’s it. The entire process usually takes only a few minutes and does not require registration, making it one of the easiest ways to buy Aerodrome Finance.

Follow us on Medium, X, Telegram, YouTube, and Publish0x to stay updated about the latest news on StealthEX.io and the rest of the crypto world.
Don’t forget to do your own research before buying any crypto. The views and opinions expressed in this article are solely those of the author.
AERO Aerodrome Finance crypto price prediction price analysis price predictionThe post Aerodrome Finance Price Prediction: Will AERO Reach $10? first appeared on StealthEX.]]>
At the time of writing, LAB trades at $16, showing significant volatility over the past month. The token reached a monthly low of $4.38 on May 29, before rallying sharply to a monthly high of $25.69 on June 3. Such large price swings highlight both the opportunities and risks associated with investing in smaller cryptocurrency projects.

CoinGecko, June 18, 2026
In this guide, you will find short-term and long-term LAB price predictions, technical analysis, key support and resistance levels, moving averages, and frequently asked questions. We will also explain how to read LAB price charts, what factors influence its value, and how beginners can interpret market signals without needing advanced trading experience. By the end of this article, you will have a clear understanding of the most important factors that could shape the future price of LAB.
| Current LAB Price | LAB Price Prediction 2026 | LAB Price Prediction 2030 |
| $16 | $15 | $25 |
Short-Term LAB Price Targets
Short-term LAB price predictions vary significantly depending on the forecasting model. While some analysts expect gradual price stabilization over the coming months, others anticipate an aggressive bullish trend that could push LAB to much higher levels if market momentum remains strong.
For the next month, the outlook remains mixed. CoinDCX projects a July 2026 price target of $14.3, with support around $12.98 and resistance near $14.5. This forecast suggests relatively stable trading with limited upside from current levels. Traders Union, however, expects a much stronger move, forecasting LAB to trade between $30.53 and $31.78, with an average price of $31.15. The gap between these estimates highlights the uncertainty surrounding short-term market conditions.
Looking six months ahead to December 2026, the difference becomes even more pronounced. CoinDCX believes LAB could reach $14.50, indicating slow but steady growth. In contrast, Traders Union forecasts a price range between $143.35 and $149.20, with an average value of $146.28. This extremely bullish scenario assumes continued adoption and strong investor demand throughout the second half of the year.
By the end of 2026, short-term LAB price predictions remain highly dependent on overall cryptocurrency market sentiment. If Bitcoin and the broader market enter another bullish cycle, LAB could outperform conservative estimates. On the other hand, weaker market conditions could keep the token trading closer to CoinDCX’s targets. As always, investors should view price predictions as possible scenarios rather than guaranteed outcomes.

Long-Term LAB Prediction (2026-2050)
| Year | Minimum Price | Maximum Price | Average Price | Price Change |
| 2026 | $14.1 | $15.94 | $15 | -4.8% |
| 2027 | $16 | $16.73 | $16.5 | +3.7% |
| 2030 | $19.29 | $32 | $25 | +48% |
| 2040 | $31.42 | $90 | $60 | +221% |
| 2045 | $40.1 | $40.27 | $40 | +153% |
LAB Price Prediction 2026
BingX estimate that in 2026, LAB may trade around $15.94 (-0%), suggesting a relatively stable year with modest upside as the project continues to develop and attract new users.
CoinDCX presents a slightly more conservative outlook for 2026. Its monthly forecasts range from $14.1 (-11%) to $14.5 (-9%), indicating that LAB could experience short-term volatility while remaining within a well-defined trading range.
LAB Price Prediction 2027
BingX expects LAB to continue its gradual appreciation in 2027, forecasting a price of $16.73 (+5%), driven by steady ecosystem expansion and improving market sentiment.
Bybit offers a similar outlook, estimating LAB could reach approximately $16.66 (+5%), reflecting moderate but sustainable long-term growth.
CoinDCX is slightly less optimistic, projecting a 2027 price target of $16 (+0%), suggesting a period of consolidation before stronger momentum returns.
LAB Price Prediction 2030
According to BingX, LAB could trade around $19.37 (+21%) by 2030, supported by increasing adoption and continued blockchain innovation.
Bybit closely aligns with this projection, forecasting a price of approximately $19.29 (+21%), assuming LAB maintains its current growth trajectory and market relevance.
CoinDCX presents the most bullish scenario for 2030. Its forecast places LAB at $32 (+100%), reflecting expectations of accelerated adoption, expanding utility, and stronger investor demand.
LAB Price Prediction 2040
BingX forecasts that LAB could reach approximately $31.56 (+98%) by 2040, representing nearly a doubling in value over the coming years under a steady growth scenario.
Bybit delivers a nearly identical estimate, projecting a price of around $31.42 (+98%), highlighting confidence in LAB’s long-term development.
CoinDCX remains significantly more optimistic. Its 2040 forecast targets $90 (+465%), assuming widespread adoption and a favorable long-term crypto market cycle.
LAB Price Prediction 2045
Looking further ahead, BingX estimates LAB could trade at approximately $40.27 (+150%) by 2045, reflecting sustained ecosystem growth and increasing blockchain adoption over the next two decades.
Bybit offers a very similar projection, forecasting a price of around $40.1 (+150%), suggesting consistent long-term appreciation if LAB continues executing its roadmap successfully.
LAB Technical Analysis
According to the latest weekly technical data from Traders Union, the overall outlook for LAB is Buy. The combined analysis shows 8 buy signals, 15 neutral signals, and only 2 sell signals, suggesting that bullish momentum still dominates despite some signs of short-term overheating.

Traders Union, June 18, 2026
Moving averages remain particularly strong. All 12 moving averages generate Buy signals, with no neutral or sell readings. This alignment indicates that LAB continues to trade above its key trend levels across short-, medium-, and long-term timeframes, confirming that buyers remain in control of the broader market structure.
Technical indicators are more balanced. They currently produce 6 buy signals, 1 neutral signal, and 6 sell signals. This mixed picture suggests that while the primary trend remains positive, momentum indicators warn that the recent rally may be slowing after a strong advance.
Several indicators point to strong bullish momentum. RSI (14) stands at 75.12, generating a Buy signal but also showing that LAB has entered an elevated momentum zone. MACD (12,26) at 0.9983, PPO, ADX (14), Ichimoku, and the Awesome Oscillator all produce Buy signals, reinforcing the positive long-term outlook.
At the same time, Williams %R, Stochastic RSI, CCI, and Bull Bear Power all signal overbought conditions, while the Momentum and HMA indicators generate Sell signals. These readings suggest that LAB could experience a short-term pullback or consolidation before attempting another move higher.
Overall, the weekly technical structure remains constructive. Strong moving averages support further upside, but traders should be aware that overbought conditions often increase short-term volatility after rapid price appreciation.
LAB Key Price Levels
Pivot points help identify areas where LAB could find support or resistance during the coming trading sessions. According to the latest weekly Traders Union analysis, the Classic Pivot Point stands at $15.8047, making it the most important level to watch.
Key support levels are:
- S1: $15.3733
- S2: $14.8907
- S3: $14.4593
As long as LAB remains above the pivot point, buyers maintain a technical advantage. A break below $15.37 could shift momentum toward the next support near $14.89, while a deeper correction may test the $14.46 area.
Key resistance levels are:
- R1: $16.2873
- R2: $16.7187
- R3: $17.2013
A breakout above $16.29 would strengthen the bullish case and could open the path toward $16.72. If buying pressure continues, the next important target sits near $17.20, which represents the strongest classic resistance level.
Woodie’s, Fibonacci, and Camarilla pivot models identify similar resistance clusters between $16.15 and $16.72, making this zone a critical area for confirming continued upside momentum.
Popular LAB Moving Averages and Oscillators
The latest weekly data from Traders Union shows that moving averages strongly support the current uptrend. Every major simple and exponential moving average generates a Buy signal.

Traders Union, June 18, 2026
Short-term moving averages remain bullish:
- MA5: 15.5524 (Buy)
- EMA5: 15.5762 (Buy)
- MA10: 14.8770 (Buy)
- EMA10: 15.0064 (Buy)
Medium-term averages also confirm strength:
- MA20: 13.9862 (Buy)
- EMA20: 14.3604 (Buy)
- MA50: 13.4571 (Buy)
- EMA50: 13.3204 (Buy)
Long-term indicators continue to support the bullish trend:
- MA100: 11.7841 (Buy)
- EMA100: 12.2807 (Buy)
- MA200: 10.4451 (Buy)
- EMA200: 11.5459 (Buy)
The oscillator picture is more mixed. MACD, RSI, ADX, PPO, Ichimoku, and the Awesome Oscillator all signal Buy, confirming healthy upward momentum. However, Williams %R (-9.26), Stochastic RSI (90.07), CCI (142.04), and Bull Bear Power indicate that LAB is currently overbought. Momentum (20) and HMA also issue Sell signals.
This combination suggests that the long-term trend remains bullish, but short-term traders should expect increased volatility. A period of consolidation would not necessarily invalidate the broader uptrend and could instead provide a healthier base for the next potential move higher.
Correlation
Like most cryptocurrencies, LAB shows a strong correlation with the broader digital asset market, especially Bitcoin and Ethereum. When Bitcoin enters a bullish trend, investor confidence often improves across the entire crypto sector, increasing demand for smaller altcoins such as LAB.
Conversely, major market corrections can create selling pressure even if LAB’s fundamentals remain unchanged. LAB also tends to correlate with overall crypto market sentiment, trading volume, and risk appetite among investors. Monitoring Bitcoin dominance, market liquidity, and macroeconomic events can therefore provide valuable clues about potential short-term and long-term LAB price movements.
LAB Price Prediction FAQ
What Is LAB’s Price Prediction Today?
Based on current technical indicators, LAB maintains a bullish outlook. Short-term forecasts suggest the token could continue trading around its current range, although daily price movements will depend on market sentiment and overall crypto volatility.
What Is the LAB Price Prediction for This Week?
Weekly technical analysis from Traders Union currently signals Buy, supported by strong moving averages. However, overbought indicators suggest LAB could experience consolidation before making another move higher.
What Is the LAB Price Prediction for Next Week?
If buying momentum continues, LAB could retest nearby resistance levels around $16.3 and $16.7. A broader market pullback, however, could push the price back toward support near $15.37.
What Will the Price of LAB Be Next Month?
Short-term forecasts differ significantly. CoinDCX expects LAB to trade around $14.3, while more bullish models project considerably higher prices. The actual outcome will largely depend on overall crypto market conditions.
What Is the LAB Price Prediction for 2026?
According to BingX, LAB could trade around $15.94, representing a relatively stable year with modest growth. CoinDCX forecasts a range between $14.1 and $14.5, suggesting limited upside but steady price action.
What Is the LAB Price Prediction for 2027?
BingX estimates LAB could reach $16.73 in 2027, while Bybit forecasts $16.66. CoinDCX remains slightly more conservative with a target of $16, pointing to gradual long-term appreciation.
What Is the LAB Price Prediction for 2030?
Long-term forecasts remain optimistic. BingX projects $19.37, Bybit estimates $19.29, while CoinDCX presents a more bullish scenario with a target price of $32, assuming stronger adoption and market expansion.
What Is the LAB Price Prediction for 2040?
BingX expects LAB to reach approximately $31.56 by 2040, with Bybit forecasting $31.42. CoinDCX offers the most optimistic estimate at $90, reflecting a highly bullish long-term adoption scenario.
Can LAB Reach $20?
Yes. Several long-term forecasts place LAB close to or above $20 before 2030. Continued ecosystem growth, increasing adoption, and a favorable crypto market could support this milestone.
Can LAB Reach $50?
Reaching $50 would require significant growth in adoption and market capitalization. Conservative forecasts remain below this level, although the most bullish long-term scenarios suggest it could become achievable over time.
Can LAB Reach $100?
A price of $100 is possible but highly speculative. Current projections from major forecasting platforms generally remain below this level, meaning LAB would require exceptional ecosystem growth and strong market conditions.
Should I Buy LAB Coin in 2026?
That depends on your investment strategy and risk tolerance. Investors who believe in LAB’s long-term development may view temporary volatility as an opportunity, while conservative investors may prefer to wait for additional market confirmation.
Will LAB Coin Go Up?
Many analysts expect LAB to appreciate gradually over the coming years. However, cryptocurrency prices remain volatile, and future performance will depend on adoption, investor sentiment, and overall market trends.
How High Can LAB Go?
Current long-term forecasts vary widely. Conservative models expect prices around $30–40 over the next two decades, while the most optimistic projections suggest LAB could eventually approach $90 under ideal market conditions.
Is LAB a Good Investment?
LAB may appeal to investors seeking exposure to emerging blockchain projects with long-term growth potential. Like any cryptocurrency, it carries substantial risk, so proper research and portfolio diversification remain essential.
How Does Our Price Prediction for LAB Work?
Our LAB price predictions combine technical analysis, historical price performance, support and resistance levels, moving averages, momentum indicators, and forecasts from multiple analytical platforms. These estimates represent possible market scenarios rather than guaranteed future prices.
How to Read and Predict LAB Price Movements?
Understanding LAB price movements does not require professional trading experience. The key is to combine technical analysis with market fundamentals and sentiment. Traders often study price charts, support and resistance levels, trading volume, and momentum indicators to estimate future direction.
At the same time, news, ecosystem development, and the overall cryptocurrency market can strongly influence LAB’s value. Looking at multiple factors instead of relying on a single indicator helps reduce emotional decisions and provides a more balanced view of potential price scenarios.
LAB Price Prediction Indicators
Several technical indicators can help investors analyze LAB price trends:
- RSI (Relative Strength Index): Measures momentum and identifies overbought or oversold conditions.
- MACD: Detects trend reversals and changes in market momentum.
- Moving Averages: Show whether buyers or sellers control the current trend.
- Support and Resistance Levels: Highlight areas where price may reverse or accelerate.
- Trading Volume: Confirms whether breakouts have strong market participation.
- ADX: Measures the strength of the current trend.
- Ichimoku Cloud: Provides a broader picture of trend direction and support zones.
Using several indicators together usually produces more reliable LAB price predictions than relying on a single signal.
How to Read LAB Charts and Predict Price Movements?
LAB charts display how the token has performed over time and help traders identify recurring patterns. An upward sequence of higher highs and higher lows usually signals a bullish trend, while lower highs and lower lows suggest increasing selling pressure.
Trendlines, moving averages, and volume can confirm whether a breakout is likely to continue. Candlestick formations also provide valuable information about buyer and seller behavior. By combining chart patterns with technical indicators and market news, investors can build a more complete picture of LAB’s potential future direction.
What Affects the Price of LAB?
Several factors can influence the value of LAB:
- Overall cryptocurrency market sentiment
- Bitcoin and Ethereum price movements
- New partnerships and ecosystem development
- User adoption and blockchain activity
- Exchange listings and liquidity growth
- Trading volume and investor demand
- Macroeconomic conditions and interest rates
- Crypto regulations and government policies
- Social media trends and community engagement
- Large investor transactions and market liquidity
These factors often work together, making LAB’s price highly sensitive to both project-specific developments and broader market conditions.
Bullish and Bearish Price Prediction Patterns
Technical chart patterns help traders estimate potential future price movements. While no pattern guarantees future performance, these formations often help identify trend continuation or reversal when combined with volume analysis and technical indicators.
Common bullish patterns include:
- Cup and Handle – Often signals trend continuation after a period of consolidation.
- Ascending Triangle – Suggests buyers are gaining strength and a breakout may occur.
- Inverse Head and Shoulders – A classic reversal pattern that may indicate the end of a downtrend.
- Double Bottom – Forms after two failed attempts to move lower and often signals a bullish reversal.
- Bull Flag – A short consolidation pattern that typically appears before another upward move.
- Falling Wedge – Usually indicates weakening selling pressure and a potential breakout higher.
- Rounded Bottom – Reflects a gradual shift from bearish to bullish sentiment.
- Golden Cross – Occurs when a short-term moving average crosses above a long-term moving average, often confirming a long-term uptrend.
Common bearish patterns include:
- Head and Shoulders – One of the strongest reversal patterns, often signaling the beginning of a downtrend.
- Double Top – Indicates strong resistance and the possibility of declining prices.
- Descending Triangle – Suggests sellers are becoming more aggressive and may trigger a breakdown.
- Bear Flag – A temporary upward correction within a larger bearish trend.
- Rising Wedge – Often signals weakening buying momentum and a potential downside reversal.
- Triple Top – Forms after repeated failures to break resistance and can precede a major decline.
- Death Cross – Happens when a short-term moving average falls below a long-term moving average, indicating bearish momentum.
- Descending Channel – Shows a consistent downtrend with lower highs and lower lows.
How To Buy LAB: Quick-Step Guide
StealthEX allows you to swap LAB quickly and privately. You do not need to create an account. You can exchange more than 2,000 cryptocurrencies with direct wallet-to-wallet transfers.
Just follow these steps:
- Choose the crypto pair and enter the amount (for example, ETH to LAB).
- Click the “Start Exchange” button.
- Enter your LAB wallet address.
- Send the funds to the provided deposit address.
- Receive LAB directly in your wallet.
That’s it. The process takes only a few minutes and does not require registration.

Follow us on Medium, X, Telegram, YouTube, and Publish0x to stay updated about the latest news on StealthEX.io and the rest of the crypto world.
Don’t forget to do your own research before buying any crypto. The views and opinions expressed in this article are solely those of the author.
crypto price prediction cryptocurrency LAB price analysis price predictionThe post LAB Price Prediction 2026, 2027-2030 first appeared on StealthEX.]]>
In this guide, you will discover detailed XCN price predictions for the coming years, from short-term forecasts to long-term outlooks extending all the way to 2050. We compare estimates from multiple forecasting models and explain what could influence the future value of Onyxcoin.
Besides price forecasts, this article also explores the project’s historical performance, technical analysis, key support and resistance levels, market correlations, and the factors that could drive future adoption. So, let’s get started!
| Current XCN Price | XCN Price Prediction 2026 | XCN Price Prediction 2030 |
| $0.004 | $0.006 | $0.12 |

Onyxcoin Overview
Onyxcoin (XCN) is the native cryptocurrency of the Onyx ecosystem, a blockchain-based financial infrastructure designed to support decentralized applications, digital payments, and tokenized assets. The project aims to connect traditional finance with blockchain technology by offering faster, more transparent, and more efficient financial services.
XCN plays several important roles within the ecosystem. Users can use the token to pay transaction fees, participate in governance decisions, and access various network features. As the platform develops, the utility of XCN may expand further, which could increase demand for the token over time.
One reason why Onyxcoin price predictions attract so much attention is the token’s relatively low price. Many investors view low-priced cryptocurrencies as an opportunity to gain exposure to the market without committing large amounts of capital. However, a low price alone does not guarantee future growth, as adoption, development activity, and overall market conditions remain the key drivers of value.
Onyxcoin Historical Price Performance
Since its launch, Onyxcoin has experienced several dramatic price cycles, reflecting both the volatility of the crypto market and changing investor sentiment.

CoinGecko, June 17, 2026
- 2022: XCN enjoyed an explosive start and reached its all-time high of approximately $0.184 on May 27, 2022. The rally attracted significant attention before a prolonged correction followed.
- 2023: The bearish market pushed Onyxcoin to its weakest level. On October 11, 2023, XCN fell to an all-time low near $0.0007, losing more than 99% from its peak.
- 2024: The token stabilized after the steep decline and spent much of the year consolidating at relatively low valuations while the project continued development.
- 2025: Onyxcoin staged an impressive recovery, climbing to almost $0.05 during the year before correcting again as profit-taking accelerated.
- 2026: XCN currently trades around $0.004, after recording a monthly low of $0.0035 and a recent high of $0.0048.
Short-Term Onyxcoin Price Targets
Let’s examine the latest short-term Onyxcoin price predictions based on forecasts from DigitalCoinPrice and CoinCheckup. While both models expect volatility, they present different scenarios for XCN during the remainder of 2026.
For the next month, July 2026, DigitalCoinPrice forecasts XCN to trade between $0.00465 and $0.00557, with an average price of $0.00511. This would represent a solid recovery from the current price around $0.004. CoinCheckup is more conservative and expects the token to remain near $0.00368, suggesting a period of sideways movement rather than a breakout.
Looking six months ahead to the end of 2026, analysts become significantly more optimistic. DigitalCoinPrice predicts that Onyxcoin could trade around $0.00995 in December, more than doubling its current value and implying a potential gain of almost 150%. CoinCheckup projects a lower range between $0.00504 and $0.00524, with an average price of $0.00514, reflecting steady but more moderate growth.
By the end of 2026, both forecasting models expect XCN to trade above today’s price, although the upside differs considerably.
Long-Term Onyxcoin Prediction (2026-2050)
| Year | Minimum Price | Maximum Price | Average Price | Price Change |
| 2026 | $0.0023 | $0.012 | $0.006 | +50% |
| 2027 | $0.0011 | $0.037 | $0.02 | +400% |
| 2030 | $0.0019 | $0.24 | $0.12 | +2,900% |
| 2040 | $0.0719 | $3.42 | $1.7 | +42,400% |
| 2050 | $0.6 | $0.68 | $0.64 | +15,900% |
Onyxcoin Price Prediction 2026
DigitalCoinPrice analysts estimate that in 2026, Onyxcoin could trade between $0.00232 (-40%) at the lower end and $0.00995 (+150%) at its yearly peak. Their forecast suggests a volatile year, with weakness during the summer followed by a strong recovery toward the end of the year.
CoinCheckup offers a more stable outlook. According to its projections, XCN may range from $0.00368 (-10%) to $0.00948 (+135%), indicating moderate growth supported by improving market sentiment and steady ecosystem development.
Telegaon remains the most bullish source for 2026. Its forecast places Onyxcoin between $0.0067 (+70%) and $0.012 (+200%), reflecting expectations of increasing blockchain adoption and renewed investor interest.
XCN Price Prediction 2027
DigitalCoinPrice expects Onyxcoin to experience significant volatility in 2027, forecasting prices between $0.0011 (-70%) and $0.00836 (+110%). The model suggests an early rally followed by an extended correction throughout much of the year.
CoinCheckup presents a considerably more optimistic scenario. Its estimates place XCN between $0.00532 (+35%) and $0.01232 (+210%), pointing to continued growth driven by stronger network activity and improving market conditions.
Telegaon remains aggressively bullish. According to its projections, Onyxcoin could trade between $0.013 (+225%) and $0.037 (+825%), assuming broader crypto market expansion and long-term ecosystem adoption.
Onyxcoin Price Prediction 2030
By 2030, DigitalCoinPrice analysts believe XCN could trade between $0.00187 (-55%) and $0.00606 (+50%). Their long-term model suggests relatively modest appreciation with periodic market cycles limiting upside potential.
CoinCheckup expects much stronger performance. Its forecasts indicate a range between $0.01348 (+235%) and $0.02051 (+415%), assuming Onyxcoin continues expanding its utility and benefits from a stronger digital asset market.
Telegaon’s long-term outlook is substantially more bullish. According to its estimates, XCN could trade between $0.093 (+2,230%) and $0.24 (+5,900%) by 2030, reflecting expectations of widespread adoption and significant capital inflows.
Onyxcoin (XCN) Price Prediction 2040
DigitalCoinPrice projects that Onyxcoin could trade between $0.0719 (+1,700%) and $0.0847 (+2,020%) in 2040. These estimates assume the project remains relevant and benefits from decades of blockchain industry growth.
Telegaon offers an even more optimistic long-term forecast. Its 2040 model places XCN between $3.07 (+76,650%) and $3.42 (+85,400%), reflecting expectations that Onyxcoin could become a major player if mass adoption and favorable market conditions materialize.
Onyxcoin Price Prediction 2050
Looking further ahead, DigitalCoinPrice estimates that Onyxcoin could trade between $0.6 (+14,900%) and $0.68 (+16,900%) by 2050. This projection assumes sustained network development and continued expansion of the broader cryptocurrency market over the coming decades.
Onyxcoin Technical Analysis
According to monthly data from Investing.com, the overall technical outlook for Onyxcoin shows Strong Sell signals, suggesting that bearish momentum continues to dominate the market.

Investing, June 17, 2026
The summary indicates broad weakness across most indicators. Technical Indicators generate 6 sell signals, 1 neutral signal, and no buy signals, while Moving Averages produce 10 sell signals and only 2 buy signals. This combination suggests that sellers remain firmly in control of the current trend.
RSI (14) stands at 43.576 and signals Sell, showing weak momentum without reaching extreme oversold territory. MACD (12,26) prints -0.001, which also supports a bearish outlook. Meanwhile, ADX (14) reads 16.87, indicating that the current trend remains relatively weak but still lacks bullish confirmation.
Several oscillators already signal oversold conditions. Stochastic (9,6) stands at 9.615, StochRSI (14) reads 0.763, Williams %R is -97.393, and the Ultimate Oscillator sits at 19.741. These values suggest that selling pressure may be approaching exhaustion. However, oversold conditions alone do not guarantee a reversal, as cryptocurrencies can remain oversold for extended periods during strong downtrends.
Overall, the monthly technical picture remains cautious. Until momentum indicators and moving averages begin shifting toward Neutral or Buy signals, short-term Onyxcoin price predictions continue to favor a bearish outlook despite the possibility of temporary relief rallies.
Onyxcoin Key Price Levels
Pivot points help traders identify areas where buying or selling pressure may increase. Based on the latest monthly data from Investing.com, the main Classic Pivot Point stands at 0.004778, which acts as the primary balance level for the current trend. Trading below this level generally favors sellers, while a sustained move above it could improve bullish sentiment.
Support Levels
The most important support zones are:
- S1: 0.004117
- S2: 0.003719
- S3: 0.003058
If XCN falls below the first support level, sellers could target the deeper support zone around 0.0037. A breakdown below 0.0031 would likely reinforce bearish momentum and increase downside risk.
Resistance Levels
The nearest resistance levels are:
- R1: 0.005176
- R2: 0.005837
- R3: 0.006234
A breakout above 0.00518 could trigger renewed buying interest and open the path toward 0.00584. If bullish momentum strengthens further, traders may target the 0.00623 region as the next major resistance.
Fibonacci, Camarilla, and Woodie pivot calculations point to similar price clusters, reinforcing the importance of the 0.0052-0.0058 area as the key resistance zone for any meaningful recovery.
Popular Onyxcoin Moving Averages and Oscillators for June 2026
According to monthly data from Investing.com, moving averages continue to reflect the current bearish structure.

Investing, June 17, 2026
Short-term moving averages all signal Sell:
- MA5 Simple: 0.004712 (Sell)
- MA10 Simple: 0.00578 (Sell)
- MA20 Simple: 0.009658 (Sell)
Medium-term averages also remain negative:
- MA50 Simple: 0.005156 (Sell)
- MA50 Exponential: 0.007678 (Sell)
- MA100 Exponential: 0.008801 (Sell)
Only the long-term Simple Moving Averages still generate Buy signals:
- MA100 Simple: 0.002578 (Buy)
- MA200 Simple: 0.001289 (Buy)
This setup suggests that while short-term momentum remains weak, the long-term trend still trades above major historical support averages.
Oscillators reinforce the cautious outlook:
- CCI (14): -95.213 (Sell)
- ROC: -77.557 (Sell)
- Bull/Bear Power: -0.0039 (Sell)
- MACD (12,26): -0.001 (Sell)
At the same time, Stochastic, StochRSI, Williams %R, and the Ultimate Oscillator all indicate oversold conditions, suggesting that selling pressure may be fading. ATR (14) stands at 0.0041, indicating relatively low volatility compared with periods of strong market expansion. While this could support stabilization, traders typically wait for confirmation from momentum indicators before expecting a sustained trend reversal.
Correlation
Positively Correlated Cryptocurrencies
Onyxcoin generally shows a positive correlation with the broader cryptocurrency market, especially during periods of strong bullish or bearish momentum. XCN often follows the direction of Bitcoin (BTC) and Ethereum (ETH), as these assets influence overall market sentiment. It may also move in line with other infrastructure and payment-focused blockchain projects, particularly when investor confidence across the altcoin sector improves.
Negatively Correlated Cryptocurrencies
Onyxcoin rarely maintains a long-term negative correlation with other digital assets. However, during periods when capital rotates into Bitcoin or large-cap cryptocurrencies, smaller tokens like XCN may temporarily underperform. In risk-off market environments, investors often shift funds away from speculative altcoins toward more established assets or stablecoins, which can create short-term divergence between XCN and the largest cryptocurrencies.
Onyxcoin Price Prediction: Questions and Answers
What Is Onyxcoin’s Price Prediction Today?
Today’s outlook remains cautious. Technical indicators point to bearish momentum, while XCN continues trading near $0.004, with support around $0.0041.
What Is the Onyxcoin Price Prediction for Tomorrow?
Tomorrow’s price will likely remain close to $0.004, although strong Bitcoin volatility could push XCN toward $0.0038 or $0.0043.
What Is the Onyxcoin Price Prediction for This Week?
Short-term forecasts suggest XCN could trade between $0.0037 and $0.0046 this week as the market looks for a new direction.
What Is the Onyxcoin Price Prediction for Next Week?
If buying pressure improves, XCN may retest $0.0048-$0.0052. Otherwise, consolidation around current prices remains the most likely scenario.
What Will the Price of Onyxcoin Be Next Month?
Current forecasts estimate a range between $0.0037 and $0.0056 over the next month, depending on market sentiment and Bitcoin’s performance.
What Is the Current XCN Price and Market Outlook?
Onyxcoin trades near $0.004. While the short-term trend remains weak, long-term growth depends on adoption and ecosystem expansion.
What Is the Onyxcoin Price Prediction for 2026?
Forecasts for 2026 range from $0.00232 to $0.012, with the most optimistic models expecting gains of up to 200% from current levels.
What Is the Onyxcoin Price Prediction for June 2026?
June forecasts place XCN between approximately $0.00368 and $0.00404, suggesting relatively stable trading conditions.
What Is the Onyxcoin Price Prediction for Q3 2026?
For Q3 2026, analysts expect XCN to fluctuate between $0.00232 and $0.00557, reflecting continued volatility across the crypto market.
What Is the Onyxcoin Price Prediction for 2027?
Analysts forecast 2027 prices between $0.0011 and $0.037, depending on the model and the pace of crypto market recovery.
What Is the Onyxcoin Price Prediction for 2030 and 2031?
Long-term estimates for 2030 range from $0.00187 to $0.24. No reliable consensus exists for 2031, making forecasts highly speculative.
Can XCN Reach $1?
Reaching $1 would require enormous market capitalization growth. While possible in theory, current forecasts remain far below that level.
Can XCN Reach $5?
A price of $5 would require exceptional adoption and massive capital inflows. Most long-term prediction models consider this highly unlikely.
Can XCN Reach $10?
Although nothing is impossible in crypto, reaching $10 would require unprecedented growth that current forecasts do not support.
Will XCN Reach $100?
A $100 valuation would imply an unrealistic market capitalization under today’s tokenomics, making this scenario extremely improbable.
Is Onyxcoin Worth Buying in 2026?
Investors seeking high-risk, high-reward opportunities may find XCN interesting, but careful research and proper risk management remain essential.
Will XCN Go Up?
Most long-term forecasts expect XCN to appreciate over time, although short-term volatility and corrections are likely along the way.
How High Will Onyxcoin Go?
Current long-term predictions range from $0.68 by 2050 to over $3 in the most bullish scenarios published by Telegaon.
Does XCN Have a Future?
Onyxcoin’s future depends on ecosystem development, real-world adoption, partnerships, and the overall growth of the blockchain industry.
Is XCN a Good Investment?
XCN could offer significant upside potential, but it also carries substantial risk due to its volatility and relatively small market size.
How Does Our Price Prediction for Onyxcoin Work?
Our analysis combines historical data, technical indicators, market trends, and forecasts from DigitalCoinPrice, CoinCheckup, and Telegaon to present balanced scenarios.
How to Read and Predict Onyxcoin Price Movements?
Understanding Onyxcoin price predictions does not require advanced trading experience. Most price movements follow market cycles such as accumulation, expansion, correction, and consolidation. By identifying the current phase, investors can make more rational decisions instead of reacting emotionally.
Combining technical analysis with market fundamentals usually produces more reliable forecasts than relying on a single indicator. Monitoring Bitcoin’s trend, trading volume, and support and resistance levels also helps estimate where XCN could move next. No prediction is guaranteed, but using a structured approach significantly improves decision-making.
Onyxcoin Price Prediction Indicators
Technical indicators help traders measure momentum, trend strength, and possible reversal points. They should always be used together rather than individually because no single indicator predicts the market with complete accuracy.
Key indicators include:
- RSI identifies overbought and oversold conditions.
- MACD measures changes in market momentum.
- Moving Averages define short-, medium-, and long-term trends.
- Trading Volume confirms breakout strength.
- Support and Resistance Levels highlight key buying and selling zones.
- ADX measures the strength of the current trend.
- Stochastic Oscillator helps identify potential reversal opportunities.
How to Read Onyxcoin Charts and Predict Price Movements?
Price charts display how buyers and sellers interact over time. Higher highs and higher lows often indicate an uptrend, while lower highs and lower lows suggest bearish momentum. Trendlines, moving averages, and candlestick formations help identify potential entry and exit points.
Investors should also monitor trading volume because strong breakouts supported by high volume tend to be more reliable. Combining chart analysis with technical indicators and fundamental developments provides a more balanced view of future XCN price movements.
What Affects the Price of Onyxcoin?
Several factors influence the value of XCN. Some are project-specific, while others depend on the broader cryptocurrency market and global economic conditions.
The main price drivers include:
- Overall Bitcoin and crypto market trends.
- Adoption and development of the Onyx ecosystem.
- Exchange listings and trading liquidity.
- Investor sentiment and market speculation.
- Partnerships and technological upgrades.
- Macroeconomic events and interest rate decisions.
- Regulatory changes affecting digital assets.
- Trading volume and institutional participation.
What Role Does Market Sentiment Play in XCN Price Predictions?
Market sentiment has a major impact on Onyxcoin’s price. During bullish periods, investors often allocate capital to smaller altcoins like XCN, increasing demand and volatility. In bearish markets, risk appetite declines and capital usually flows back into Bitcoin or stablecoins. News, social media activity, and macroeconomic events can quickly shift sentiment and influence short-term price movements.
Bullish and Bearish Price Prediction Patterns
Chart patterns help traders estimate the probability of future price movements. While they do not guarantee outcomes, they often provide valuable confirmation when combined with technical indicators and volume analysis.
Common bullish patterns:
- Ascending Triangle
- Cup and Handle
- Double Bottom
- Bull Flag
Common bearish patterns:
- Descending Triangle
- Head and Shoulders
- Double Top
- Bear Flag
How to Buy Onyxcoin: Quick-Step Guide
You can buy Onyxcoin (XCN) on several major cryptocurrency exchanges, including Kraken, Coinbase, Gate.io. If you prefer a fast, wallet-to-wallet swap without creating an account, StealthEX offers an easy alternative.
StealthEX allows you to exchange more than 2,000 cryptocurrencies quickly and privately with direct transfers between wallets. No registration is required.
Just follow these steps:
- Choose the exchange pair and enter the amount you want to swap (for example, ETH to XCN).
- Click the “Start Exchange” button.
- Enter your Onyxcoin (XCN) wallet address.
- Send your cryptocurrency to the deposit address provided by StealthEX.
- Wait a few minutes and receive your XCN directly in your wallet.

The entire process is simple, secure, and designed for beginners who want to buy Onyxcoin without opening an exchange account or completing lengthy registration procedures.
Follow us on Medium, X, Telegram, YouTube, and Publish0x to stay updated about the latest news on StealthEX.io and the rest of the crypto world.
Don’t forget to do your own research before buying any crypto. The views and opinions expressed in this article are solely those of the author.
crypto price prediction Onyxcoin price analysis price prediction XCNThe post Onyxcoin (XCN) Price Prediction 2026, 2027-2030 first appeared on StealthEX.]]>